
From Points to Probabilities: Capturing the Subjectivity of Musical Emotion
6350_Prediction of the Distribution of Perceived Music Emotions Using Discrete Samples.
This paper introduces a novel Music Emotion Recognition (MER) framework that models perceived music emotion as a probability distribution in the 2D Valence-Arousal (VA) plane rather than a single point. Using Kernel Density Estimation (KDE) for ground truth and Support Vector Regression (SVR) for predicting emotion mass at discrete samples, the method achieves a significant of 0.5439.
TL;DR
Music emotion is notoriously subjective; what sounds "peaceful" to one might sound "melancholy" to another. This paper shifts the paradigm of Music Emotion Recognition (MER) from predicting a single value to predicting a probability distribution across the Valence-Arousal plane. By leveraging Kernel Density Estimation and specialized regressor fusion, the authors achieve an of 0.5439, providing a much-needed framework for personalized music retrieval.
The Problem: The "Mean" Listener Does Not Exist
Standard machine learning models for music emotion recognition (MER) typically try to map audio features to a single category (e.g., "Happy") or a single coordinate in the 2D Valence-Arousal (VA) space.
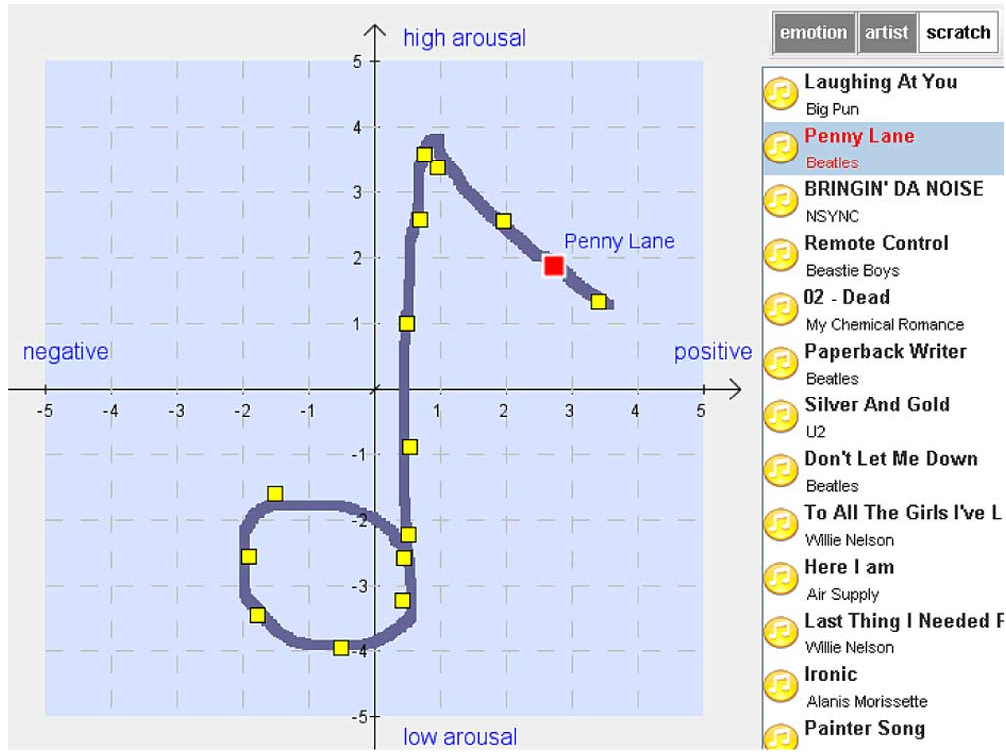
However, human emotion perception is inherently noisy and subjective. As shown in the paper's motivation, when multiple people rate the same song, their responses form a "cloud" rather than a point. Reducing this cloud to a single mean value discards critical information about the ambiguity or multi-modality of a song's emotional impact. Previous "universal" models failed to improve because they ignored this fundamental trait of human cognition.
Methodology: Mapping the Emotion Mass
The authors propose a system that treats emotion as a "mass" distributed across an grid on the VA plane.
1. Ground Truth via KDE
Instead of simple averaging, they use Kernel Density Estimation (KDE) to transform discrete human annotations into a continuous probability density function. This captures whether a song has a "focused" emotional meaning or a "spread out," ambiguous one.
2. The Architecture
The system follows a three-stage pipeline:
- Feature Extraction: Extracting five perceptual dimensions: Melody/Harmony, Spectral (Noisiness), Temporal (Rhythm), Rhythmic (Tempo), and Lyrics (Semantic).
- Independent Regressors: Training an array of Support Vector Regressors (SVR) to predict the "emotion mass" at each of the 64 grid points.
- Model Fusion: A novel -weighted fusion mechanism that gives more weight to feature sets that perform better at specific locations in the emotion plane (e.g., using Rhythmic features for high-arousal areas).
Experimental Insights & Results
The authors compared their KDE approach against a "Single-Gaussian" approach (predicting only mean and variance).
Key Findings:
- KDE Superiority: The non-parametric KDE approach achieved an of 0.5057, significantly outperforming the Single-Gaussian model (: 0.3962). This suggests that musical emotion distributions are often too complex to be captured by a simple bell curve.
- Fusion Gains: By fusing multiple feature sets (Audio + Lyrics), the climbed to 0.5439.
- Valence vs. Arousal: Consistent with prior literature, the model was much better at predicting Arousal (energy) than Valence (positivity/negativity), confirming that the "musical "code" for pleasantness is more complex than the code for energy.
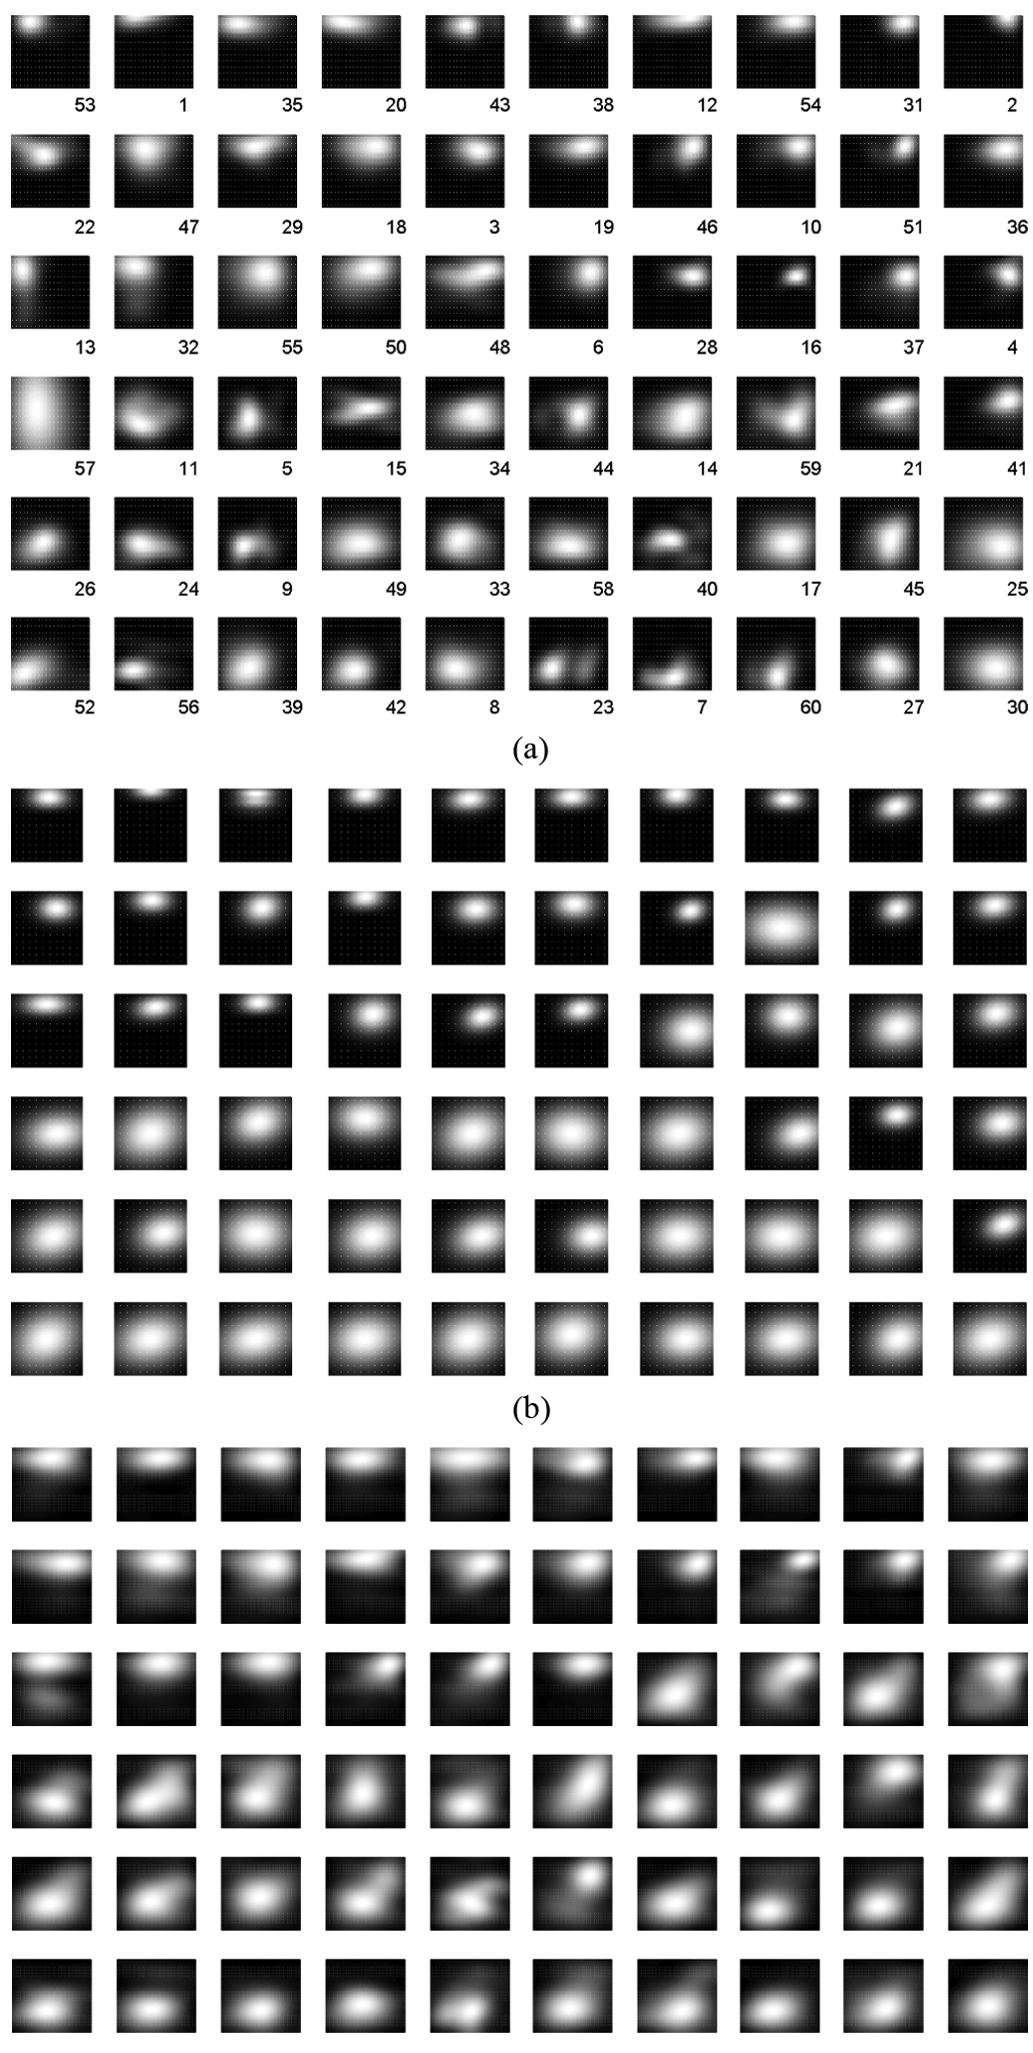 Figure: The local performance shows that different features (Melody vs. Rhythm) excel in different emotional quadrants.
Visualizing Music Clusters
By treating emotions as distributions, the authors could cluster songs based on their distribution similarity (using Jensen-Shannon Divergence). This reveals nuanced clusters:
- Cluster A: High energy, negative valence but with "hopeful" outliers (e.g., Nirvana's Smells Like Teen Spirit).
- Cluster D: Highly subjective songs where listeners were split on the perceived emotion.

Critical Analysis & Conclusion
Takeaway
This work move MER from "objective labeling" to "probabilistic modeling." By acknowledging that a song can be multiple things to different people, it bridges the gap between signal processing and psychological reality.
Limitations
- Sample Size: The dataset (60 songs) is small by modern standards, though the high number of annotators per song (40) provides high-quality labels.
- Temporal Dynamics: The model uses 30-second clips, potentially ignoring how emotion fluctuates within a song.
Future Outlook
The logical next step is Personalized MER: combining these general distributions with an individual's "personal prior" (their cultural background or personality) to predict exactly how one specific person will feel when the play button is pressed.