
Mining Complaints for Traffic-Jam Estimation: People as Social Sensors
860_Mining Complaints for Traffic-Jam Estimation A Social Sensor Application.
The paper introduces a novel traffic-congestion estimation model that utilizes Twitter as a "social sensor" by mining user complaints. The core method uses a shift-based linear regression approach to correlate social media volume with real-world traffic delay, specifically focusing on the I-405 freeway in Los Angeles.
TL;DR
Researchers from UC Santa Barbara have developed a way to estimate traffic jam severity by "listening" to driver complaints on Twitter. By recognizing that human frustration peaks differently at different times of the day, their Shift-Based Model improves estimation accuracy by 38% over traditional linear models, turning social media noise into a high-precision urban sensor.
Background Positioning
In the intersection of Big Data and Urban Informatics, social media is often used as a "soft sensor" to complement physical sensors (like loop detectors). While most existing work assumes more traffic equals more tweets, this paper provides a critical psychological correction: it’s not just about the severity of the jam, but how annoying it is at 8:00 AM versus 6:00 PM.
Problem & Motivation: The Flaws of Linear Thinking
The "Naive Linear Model" assumes that if 10 tweets represent a 20-minute delay, 20 tweets must represent a 40-minute delay. However, human behavior is rarely that consistent.
The authors identified two major blind spots in prior research:
- Latent Emotional Factors: Driver mood, fatigue, and "complaint fatigue" vary throughout the day. A morning commuter might be stoic, while an evening commuter is exhausted and more likely to vent.
- The "Noise" of Automation: Automated traffic bots and news accounts dump high volumes of data that do not reflect the actual human experience of the congestion.
Methodology: The Shift-Based Correction
The researchers combined two datasets: ground truth traffic data from CALTRANS (PeMS) and geo-filtered Twitter data centered on the notorious I-405 freeway in Los Angeles.
1. The Human Filter
Instead of using all "traffic" tweets, they applied strict filters to ensure the data came from drivers currently stuck in traffic. This included identifying "traffic selfies" or phrases indicating the user was behind the wheel—actions that are ironically illegal in California but provide high-signal data for researchers.
2. Temporal Decomposition
The core innovation is splitting the data into three shifts:
- AM Shift (5 AM - 10 AM)
- NOON Shift (10 AM - 3 PM)
- PM Shift (3 PM - 8 PM)
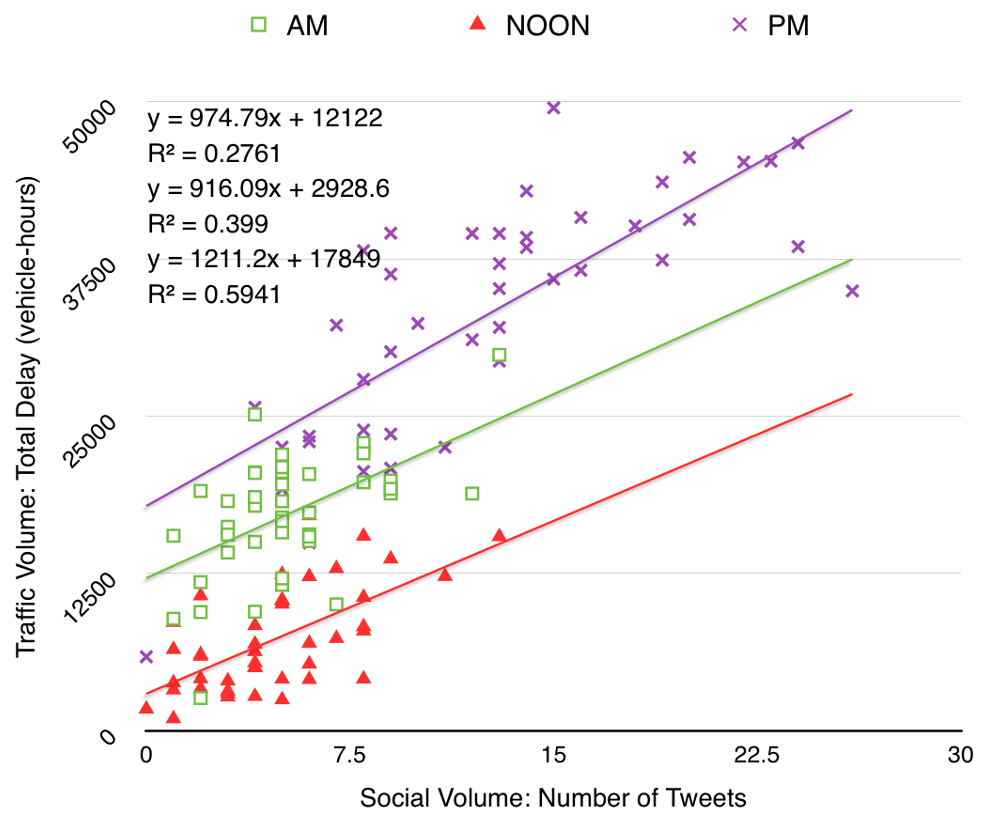 Figure: The data clusters differently across shifts, showing that a single linear line (Naive) fails to capture the nuances of each time period.
Experiments & Results: Accuracy Through Segregation
When the researchers analyzed the "Traffic Volume to Social Volume" ratio, they found that time of day was a much stronger predictor than weather or the day of the week.
Performance Gains
By treating each shift with its own linear regression sub-model, the researchers saw a massive drop in error rates:
- Absolute Error Improvement: 38%
- Relative Error Improvement: 45%
 Table: Statistical breakdown showing how traffic peaks in the PM shift, specifically on Thursdays and Fridays, correlating with a spike in complaints.
The "Driver Constraint" Validation
A key find was that excluding non-driver tweets (news bots) significantly lowered the error of the model. Using raw social volume results in an absolute error that is nearly 20% higher, proving that "who" is tweeting matters as much as "how much."
Critical Analysis & Conclusion
Takeaway
The paper proves that humans are not objective measuring devices; we are filtered sensors. Any application attempting to mine physical world events from social data must account for the context of the human observer—in this case, the time-specific psychology of the commute.
Limitations
- Manual Filtering: The "human filter" used to identify drivers requires manual effort, which is difficult to scale without advanced NLP/Computer Vision classifiers.
- Local Specificity: The model was calibrated for the I-405 in LA. While traffic patterns might be similar elsewhere, "complaint cultures" may vary in different cities or countries.
Future Outlook
This work paves the way for "Traffic Estimation as a Service" in regions where physical infrastructure (VDS stations) is missing. By using refined social sensors, cities can estimate infrastructure needs using nothing but the public’s collective frustration.