
Leveraging Collective Intelligence for Urban Mobility: Real-Time Traffic Mapping in Maputo
9510_A Collective Intelligence Based System for Visualizing Problems in Public Roads.
This paper introduces a collaborative intelligence application, part of the EquiUrbis project, designed to estimate the probability of traffic problems in Maputo, Mozambique. It leverages the concept of Collective Intelligence (CI) and Collaborative Transformation (CT) to aggregate user-reported data from social networks (Twitter) and mobile devices to provide real-time traffic condition maps.
TL;DR
Researchers have developed a collaborative system that transforms social media "noise" into structured traffic intelligence for Maputo, Mozambique. By analyzing localized keywords and user reports, the system provides a real-time probability map of traffic disruptions, addressing the critical lack of urban mobility data in developing regions.
The Data Gap in Developing Urban Centers
In many rapidly growing cities like Maputo, traditional Intelligent Transport Systems (ITS) are either non-existent or prohibitively expensive. Citizens face daily "invisible" hurdles: sudden floods, unannounced road closures, and extreme congestion. Prior work highlights that while people are willing to share information, the lack of a centralized, filtered, and geographically localized platform prevents this data from becoming useful.
The core challenge lies in the SOTA (State of the Art) gap: localized contexts require more than just GPS data—they require the "human-as-a-sensor" approach to understand why a road is blocked (e.g., an "atropelamento" or "enchente").
Methodology: From Tweets to Traffic Probability
The authors utilize the EquiUrbis framework, focusing on Collective Intelligence (CI). The architecture follows a multi-step pipeline:
- Data Acquisition: Harvesting reports from Twitter and a dedicated mobile application.
- Filtering & Weighting: Not all reports are equal. The system uses a keyword-based algorithm where terms are weighted by their historical correlation with actual traffic events.
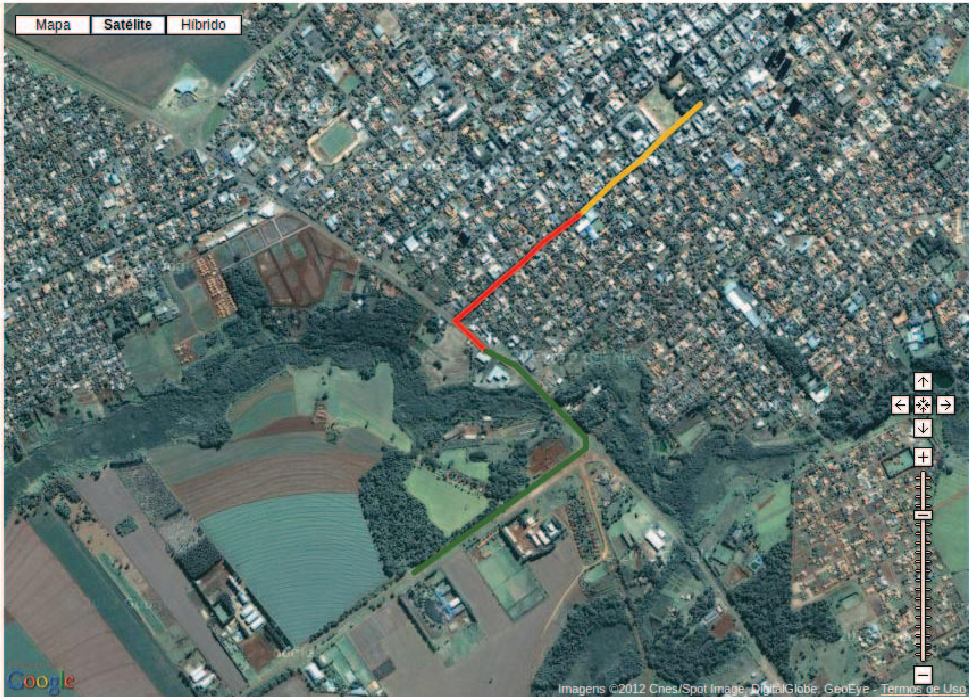
- Visualization: Using the Google Maps API, the system renders a "Heat Map" based on probability scores.
Architectural Logic
The system defines probability through a weighted sum of reports within a specific timeframe (e.g., 30-60 minutes).
- High Weight: Keywords like "Trânsito parado" (98% correlation) carry more weight.
- Low Weight: General terms like "Ônibus quebrado" carry lower weight.
Experimental Insights & Results
The study conducted a qualitative and quantitative analysis of localized keywords. The results showed that certain categories of urban problems are highly "trackable" via social media:
| Category | Key Statistics | Average Correlation |
|---|---|---|
| Congestion | "Trânsito lento/parado" | 90% |
| Floods | "Enchente/Alagamento" | 76% |
| Accidents | "Acidente/Atropelamento" | 74% |
The integration results in a 3-tier probability scale:
- Green: Low probability (Weight 0-19)
- Yellow: Medium probability (Weight 20-59)
- Red: High probability (Weight 60+)
(Note: The map visualization shows specific segments of Maputo, such as Av. Moçambique, marked in yellow or red based on user-input intensity.)
Critical Analysis & Future Outlook
The primary strength of this research is its Practicality. By leveraging existing social platforms (Twitter), it bypasses the need for expensive sensor networks (induction loops or cameras).
Limitations:
- Language Nuance: Currently, the system relies on exact keyword matching. It handles "Sentiment" in a rudimentary way, which might misinterpret sarcasm or unrelated news reports.
- Verification: The system assumes user honesty; a malicious actor could theoretically report "ghost" accidents to redirect traffic.
Future Work: The authors suggest incorporating a more robust NLP engine to improve the "Sentiment Analysis" module and integrating historical data to move from Reactive to Predictive traffic modeling.
Conclusion
This paper serves as a blueprint for "Low-Cost SOTA" in urban planning. It proves that in the absence of high-tech infrastructure, Collective Intelligence and community participation can provide the necessary data to improve the quality of life for thousands of daily commuters.