
Decoding Corporate Power: Using Social Network Analysis to Map the Real Enron
How to Analyze Company Using Social Network?
This paper presents a framework for evaluating company structure by extracting an informal social network from internal communications. Using the Enron email corpus as a case study, it employs a multi-metric "Social Score" to identify organizational leaders and compares these results against the official hierarchy using Kendall’s rank correlation.
TL;DR
Is the person at the top of the org chart actually the most influential? This paper analyzes the infamous Enron email corpus to see if we can reconstruct a company's hierarchy just by looking at who talks to whom. By calculating a multi-factor Social Score, the researchers found that while formal management usually dominates communication, there are significant "hidden influencers"—particularly among female staff—whose social impact far outweighs their official titles.
Background: The Informal Org Chart
Every company has two structures: the one printed in the employee handbook (the formal hierarchy) and the one that actually gets work done (the social network). The problem is that managers often only see the former. This study aims to bridge that gap by using Social Network Analysis (SNA) to extract the "natural" social network from electronic footprints.
The Methodology: Computing the "Social Score"
The authors didn't just count emails. They built a sophisticated ranking system based on 11 different dimensions of interaction:
- Activity: Raw email counts and average response times.
- Cohesion: The number and size of "cliques" (tight-knit sub-groups) an employee belongs to.
- Centrality: Using metrics like Betweenness Centrality (who acts as a bridge between departments?) and Hubs-and-Authorities (who is the go-to source for information?).
To validate their findings, they created a Hierarchical Position (HP) metric to represent the official rank and used Kendall’s τ rank correlation to see how well the social network matched reality.
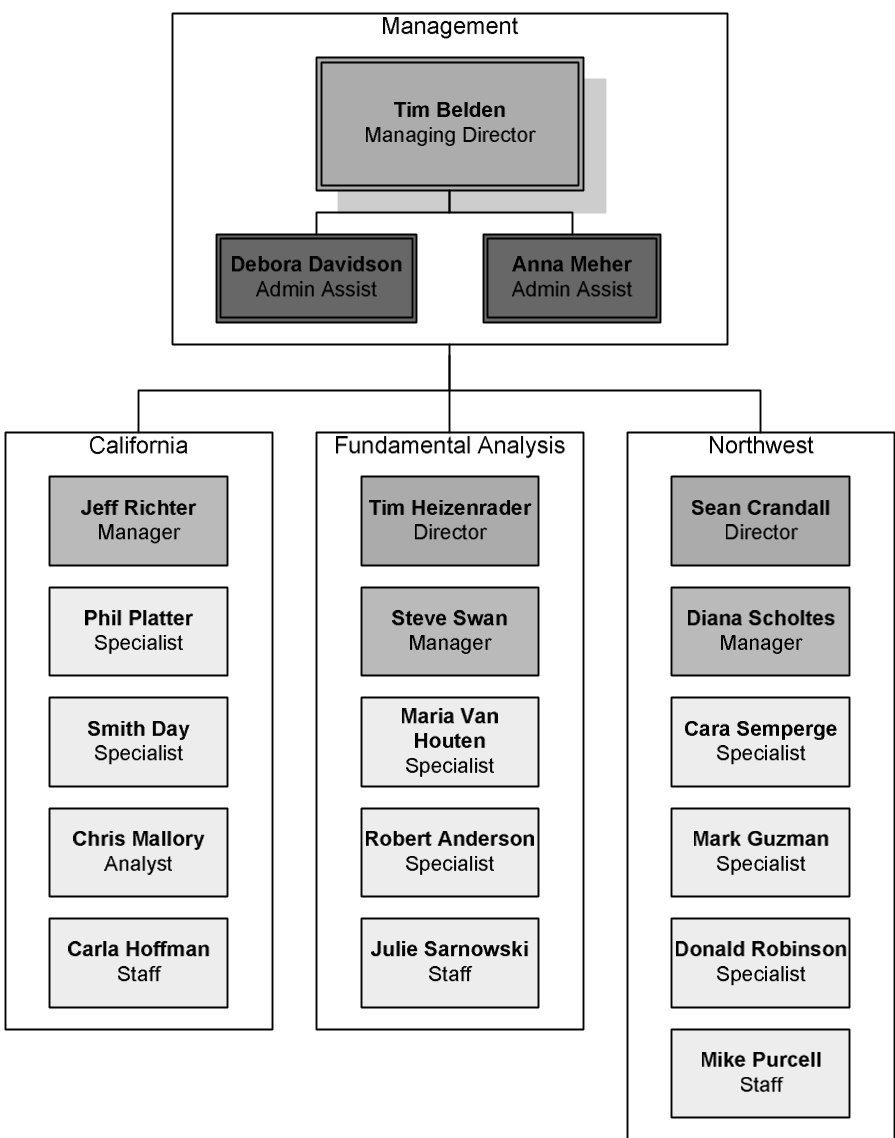 Fig 1: The reconstructed Enron hierarchy used for the study.
Key Insights from Enron
The results confirm that rank and communication are highly correlated. At Enron, the Management department showed a perfect correlation (1.0) between their social score and their official rank.
However, the most fascinating findings appear when the correlation breaks down. The researchers noticed "structural holes" where social influence and formal power diverged.
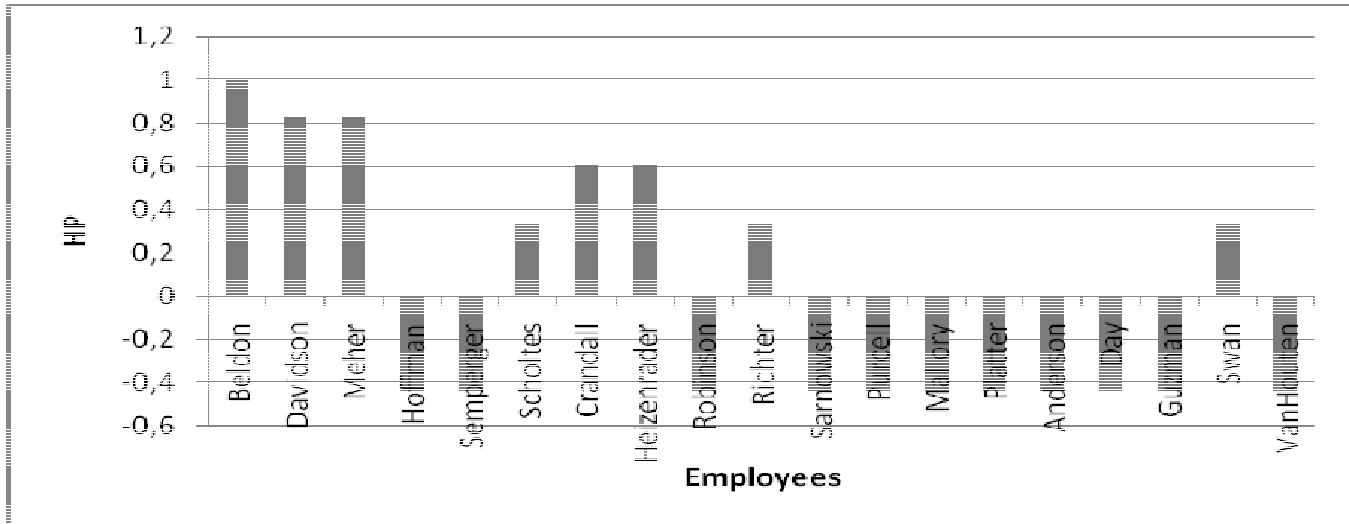 Fig 2: Visualization of Hierarchical Positions sorted by Social Score. The "dips" represent employees with high social influence but lower formal rank.
The "Hidden Influencer" Phenomenon
A striking observation in the Enron data was that many employees who ranked much higher in the social network than in the official hierarchy were women. For instance, several women classified as "Staff" or "Specialists" were in the top 6 of the social ranking.
The authors propose three provocative reasons for this:
- Underestimation: These women were performing high-level coordination roles but were under-promoted.
- Sociology: Potential gender-based differences in communication styles (e.g., higher frequency of social "maintenance" talk).
- Data Bias: Limitations in how hierarchical titles were assigned in the research.
Critical Analysis & Conclusion
This work demonstrates that SNA is not just an academic exercise—it is a mirror for corporate health. By identifying people with high "Betweenness Centrality," a company can find its true "connectors" who prevent silos from forming.
Limitations
The study is limited by the accuracy of the Enron dataset, which is notoriously messy after years of redactions and integrity fixes. Furthermore, "Social Score" cannot distinguish between productive communication and noise (like gossip or administrative logistics), which might inflate the scores of assistants.
Future Outlook
As we move into the era of AI-driven HR (People Analytics), the techniques described here—moving beyond simple org charts to dynamic network mapping—will become standard. The real challenge for future researchers is to integrate sentiment analysis into these graphs to understand not just how much people are talking, but the quality and intent of those interactions.
Takeaway: Your next promotion might depend less on your boss’s opinion and more on your "Social Score" within the company’s digital nervous system.