
Decoding the Ceiling: Why Your Next Check-in is Harder to Predict Than Your Moves
Analyzing Location Predictability on Location-Based Social Networks
This paper investigates the theoretical upper bounds of location predictability in Location-Based Social Networks (LBSNs) using entropy estimation and Fano’s inequality. Analyzing large-scale datasets from Jiepang and Gowalla, it identifies potential predictability limits of 25% and 38% respectively, significantly lower than prior cell tower studies.
TL;DR
Is human behavior truly predictable? While early mobile network studies suggested a staggering 93% predictability in our movements, new research on Location-Based Social Networks (LBSNs) like Jiepang and Gowalla paints a much more complex picture. This paper reveals that due to the selective, proactive nature of "checking in," the theoretical accuracy limit for predicting your next POI (Point of Interest) drops to between 25% and 38%.
The "Selectivity" Gap: Why LBSNs are Different
Previous mobility research relied on passive data (cell towers), which logs your location whenever your phone pings the network. LBSN data is active; you only check in when you choose to share. This creates three major hurdles for researchers:
- Discontinuity: Users don't check in at the grocery store or a gas station—only "interesting" places. This hides the routine "connective tissue" of daily life.
- Fine Granularity: Predicting a specific cafe in a mall is much harder than predicting a 1km² cell tower sector.
- Semantic Overlap: Multiple POIs (a gym, a cinema, and a bar) can exist at the same physical coordinate, adding layers of intent that physical tracking lacks.
Methodology: Entropy as a Measurement of Randomness
To find the "predictability ceiling," the authors treat a user's check-in history as a stochastic process. They use Lempel-Ziv entropy estimation to measure the information density of these traces.
The workflow follows a rigorous mathematical transformation:
- Entropy (): Measures the uncertainty of the sequence.
- Fano’s Inequality: Acts as a bridge, converting abstract entropy (bits) into a concrete probability of correct prediction ().
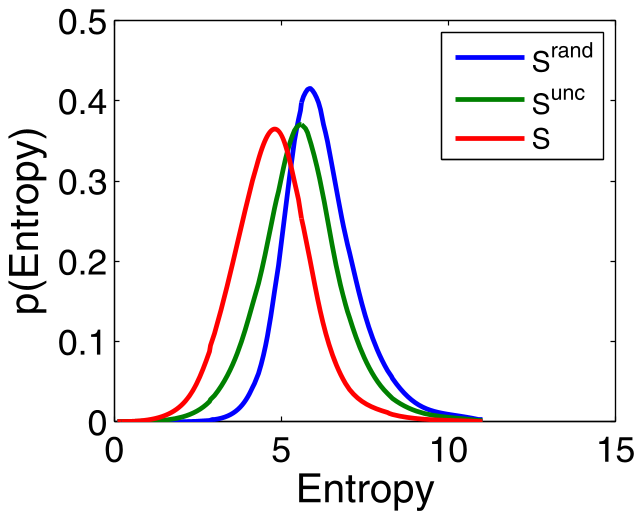 Figure 1: The distribution of entropy across users. Note the high peaks, indicating significant uncertainty compared to cell tower data.
Key Insights: Who is Most Predicable?
The paper goes beyond math to analyze the demographics of predictability. By correlating profile data with their calculated , they discovered:
- The Student Effect: Users under 24 (primarily students) are the most predictable. Their lives revolve around a tight campus-dormitory-canteen triangle.
- The "Influencer" Paradox: Users with high follower counts are harder to predict. Why? They are often more conscious of their "digital signal" and avoid checking in at routine, mundane locations to maintain an interesting social feed.
- Gender Differences: In the Jiepang dataset, male users showed higher regularity, often checking in at functional locations like office buildings and transit hubs, whereas female users frequented more diverse social POIs like coffee shops and malls.
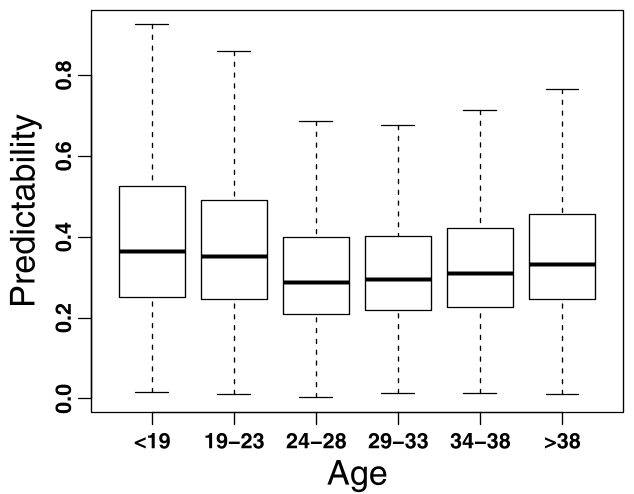 Figure 2: Box plots showing how gender and age groups significantly shift the predictability median.
The Statistical Limit
The authors show that the maximum possible accuracy () peaks at 25% for Jiepang and 38% for Gowalla. This is the Inductive Bias of the medium itself—no algorithm, no matter how advanced (even modern LSTMs or Transformers), can exceed this limit if they only look at a user's personal history.
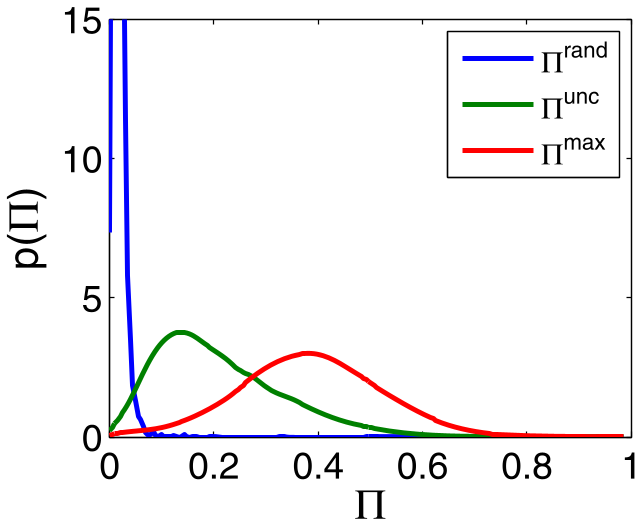 Figure 3: Distribution of the predictability limit. Most users fall within the 0.2-0.4 range.
Critical Analysis & Conclusion
Takeaway
This work provides a "reality check" for the LBSN research community. It proves that the "Next POI Prediction" task is fundamentally different—and harder—than "Next Location Prediction."
Limitations
The study assumes a closed world—it only predicts locations a user has previously visited. It doesn't account for the "Cold Start" problem or discovery of new locations, which are central to real-world recommendation systems.
Future Outlook
To break the 38% ceiling, the authors suggest we must move beyond individual history. The next frontier involves social and collaborative entropy: how much can your friends' movements or users with similar "mobility DNA" reduce the uncertainty of your own future check-ins?