
NodeXL: Democratizing Social Network Analysis via the Ubiquitous Spreadsheet
Analyzing Social Media Networks with NodeXL
This paper introduces NodeXL, an open-source, extensible toolkit implemented as a Microsoft Excel add-in for social network analysis (SNA) and visualization. It bridges the gap between complex SNA tools and everyday productivity software, achieving a democratized approach to network science through a familiar spreadsheet interface.
TL;DR
NodeXL is a transformative add-in for Microsoft Excel that simplifies the complex world of Network Science. By treating a "network graph" as just another chart type—much like a pie or bar chart—it allows researchers and managers to import, analyze, and visualize social media connections without writing a single line of code.
Background: Why the Spreadsheet?
For years, Social Network Analysis (SNA) was trapped behind a "command-line wall." Tools like Pajek or R’s SNA library were powerful but required a level of technical overhead that many domain experts simply couldn't afford. The authors recognized an inflection point: as social media authoring tools matured, the analysis tools lagged behind. NodeXL was designed to meet users where they already work—the spreadsheet.
The Problem: The Complexity Gap
The core difficulty in network analysis isn't just the math (Calculating Eigenvector Centrality or Clustering Coefficients); it's the Workflow. Data is often messy, coming from fragmented sources like email headers or Twitter feeds. Traditional tools make the "Clean-Calculate-Visualize" loop cumbersome.
The authors argue that by using Excel, users gain:
- Familiarity: Using formulas to clean data or "Bad" cell styles to flag inaccurate metrics.
- Flexibility: Sorting nodes by date or filtering edges by "Tie Strength" becomes a native operation.
Methodology: The Three Pillars of NodeXL
NodeXL is structured into three extendable layers that manage the lifecycle of a network data set.
1. Data Importation
The tool doesn't just open files; it proactively extracts data. It can crawl Windows Desktop Search for email reply-to patterns or pull subscription data from Twitter. This modular approach allows the community to build new "connectors" for any social platform.
2. The Analysis Engine
NodeXL calculates the "DNA" of a network, including:
- Degree Centrality: Who is the most connected?
- Betweenness Centrality: Who acts as a bridge between silos?
- Clustering Coefficients: How "cliquey" is a specific group?
3. Visual Exploration (The Layout Engine)
This is where the data becomes a story. The tool provides a canvas where node size can be mapped to degree, and color can be mapped to a clustering coefficient.
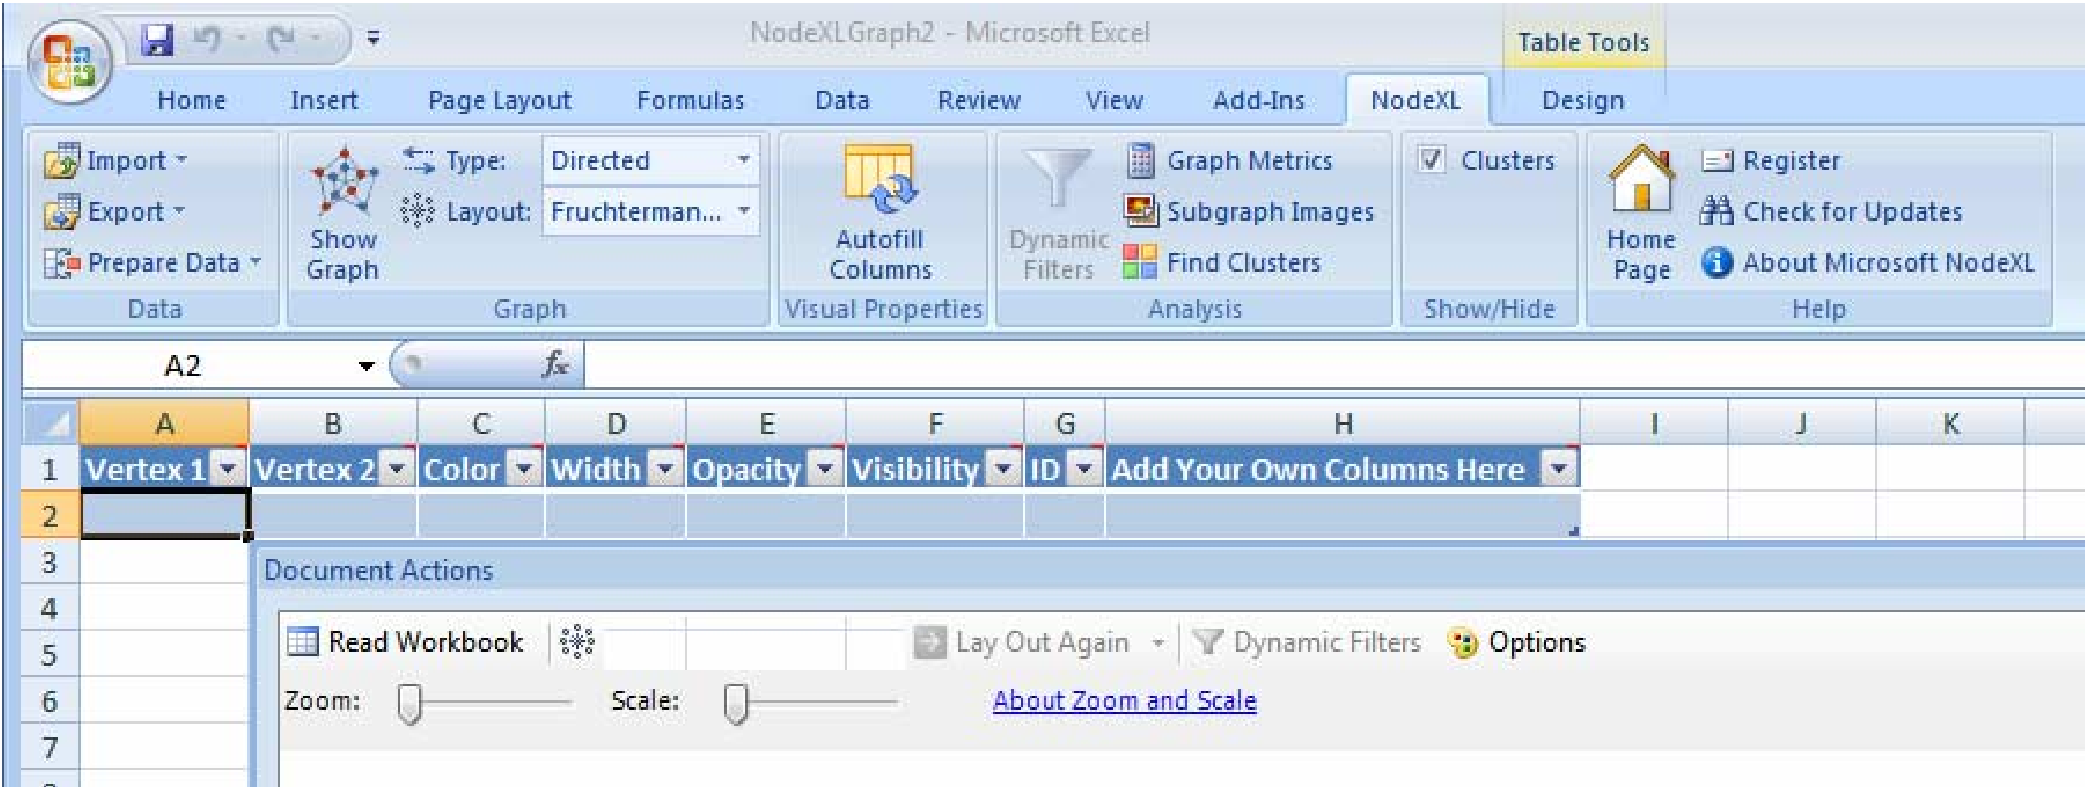 Figure 1: The NodeXL interface integrating the edge list (Excel) with the Graph Display pane.
Real-World Insights: Analyzing the Enterprise
The paper demonstrates the tool's power using a dataset of an internal corporate social network. Through iterative filtering and layout adjustments, the authors could see things the raw data hid:
- Highly connected employees (large circles) often had lower clustering coefficients (shades of red), meaning they connected disparate groups who didn't know each other—a classic "broker/connector" role.
- New hires could be tracked over time using a grid layout, showing how quickly they integrated into the company weave.
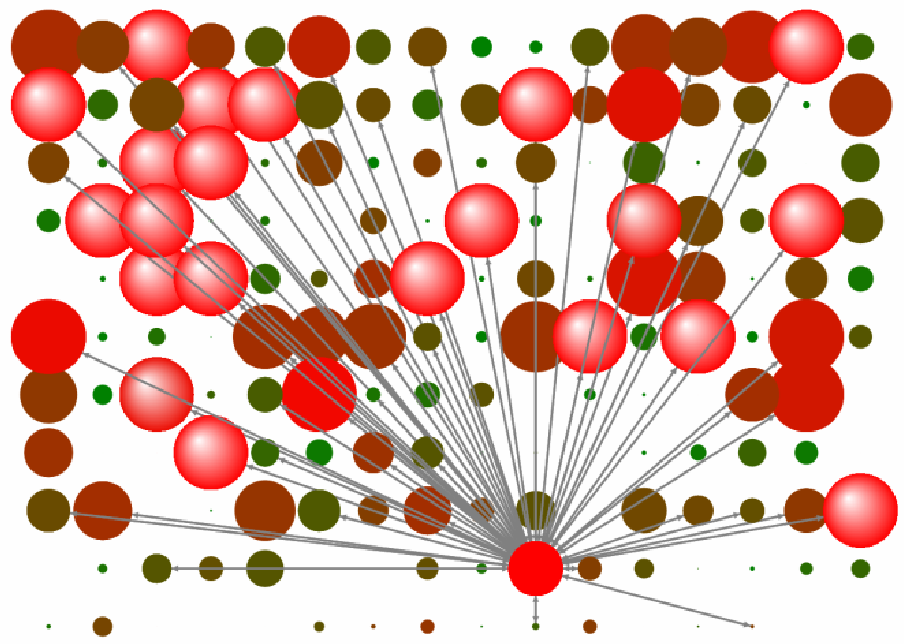 Figure 2: A Time-Sorted Grid Layout. Node size represents connections (in-degree), while color represents social density (clustering coefficient).
Critical Insight: The Value of "Small Multiples"
One of the standout features discussed is the Ego-centric Sub-graph. Sometimes a whole graph of 10,000 nodes is just "hairball" noise. NodeXL automates the creation of hundreds of small "personal networks" (1.5 degrees of separation) and inserts them directly into Excel cells. This allows for a "visual sort"—ranking people by how their personal networks look.
Conclusion & Future Outlook
NodeXL represents a paradigm shift from "Network Science as a Specialty" to "Network Science as a Utility." While it lacks the scale to handle billions of nodes (limited by the RAM and Excel’s row limits), it excels in the "Middle Scale"—thousands of nodes where human-meaningful patterns reside.
Takeaway for the Industry: In an era of "Big Data," the "Human-Scale Data" handled by tools like NodeXL is often where the most actionable organizational insights are found. The future of this work lies in better automated clustering and even deeper integration with live social media APIs.