
Social Network Analysis: Decoding the Hidden Architecture of Human Interaction
[applications CORNER]
This article provides a foundational overview of Social Network Analysis (SNA), detailing its evolution from sociometry to a mature structural paradigm. It covers core methodologies including vertex indexing (Closeness/Betweenness), community decomposition (k-cores/Modularity), and statistical modeling, while emphasizing the critical role of custom visualization in exposing hidden social power dynamics.
TL;DR
Social Network Analysis (SNA) is no longer just for sociologists; it is a rigorous computational paradigm used to map influence, group cohesion, and information flow. By shifting focus from individuals to relations, SNA utilizes graph-theoretic indices and statistical modeling to uncover hidden power structures that formal organizational charts often miss.
Contextual Positioning
This work serves as a seminal primer in the intersection of sociology and computer science. It positions SNA as a mature field that has evolved from the "Small World" phenomena and "Preferential Attachment" theories of the late 90s into a toolkit capable of analyzing everything from systems biology to bibliometry.
Motivation: Why Structural Perspective Matters
The fundamental problem in understanding organizations is that formal hierarchies are often decoupled from reality. The author notes that "structural perspective" prevents us from looking at isolated entities. Instead, it asks: Why do birds of a feather flock together? and Are people with influential friends more powerful? The challenge lies in translating these social intuitions into mathematical rigor without losing the nuance of human interaction.
Methodology: The Three Pillars of SNA
The paper decomposes the analysis process into three distinct methodological tracks:
1. Indices (Ranking the Parts)
Indices like Betweenness Centrality quantify the "control" a vertex has over the network. This formula captures the number of shortest paths passing through a specific node . If lies on many paths, it acts as a gatekeeper of information.
2. Decompositions (Finding the Clusters)
While "Cliques" (fully connected subgraphs) are the gold standard for cohesion, they are often too rigid. The author highlights k-cores as a more computationally efficient way to find nested, dense regions by iteratively pruning low-degree nodes.
3. Modeling (Predicting the Future)
Beyond mere description, Actor-based models examine the coevolution of network ties and individual behavior, distinguishing between social influence (neighbors making you like them) and social selection (you choosing neighbors who are like you).
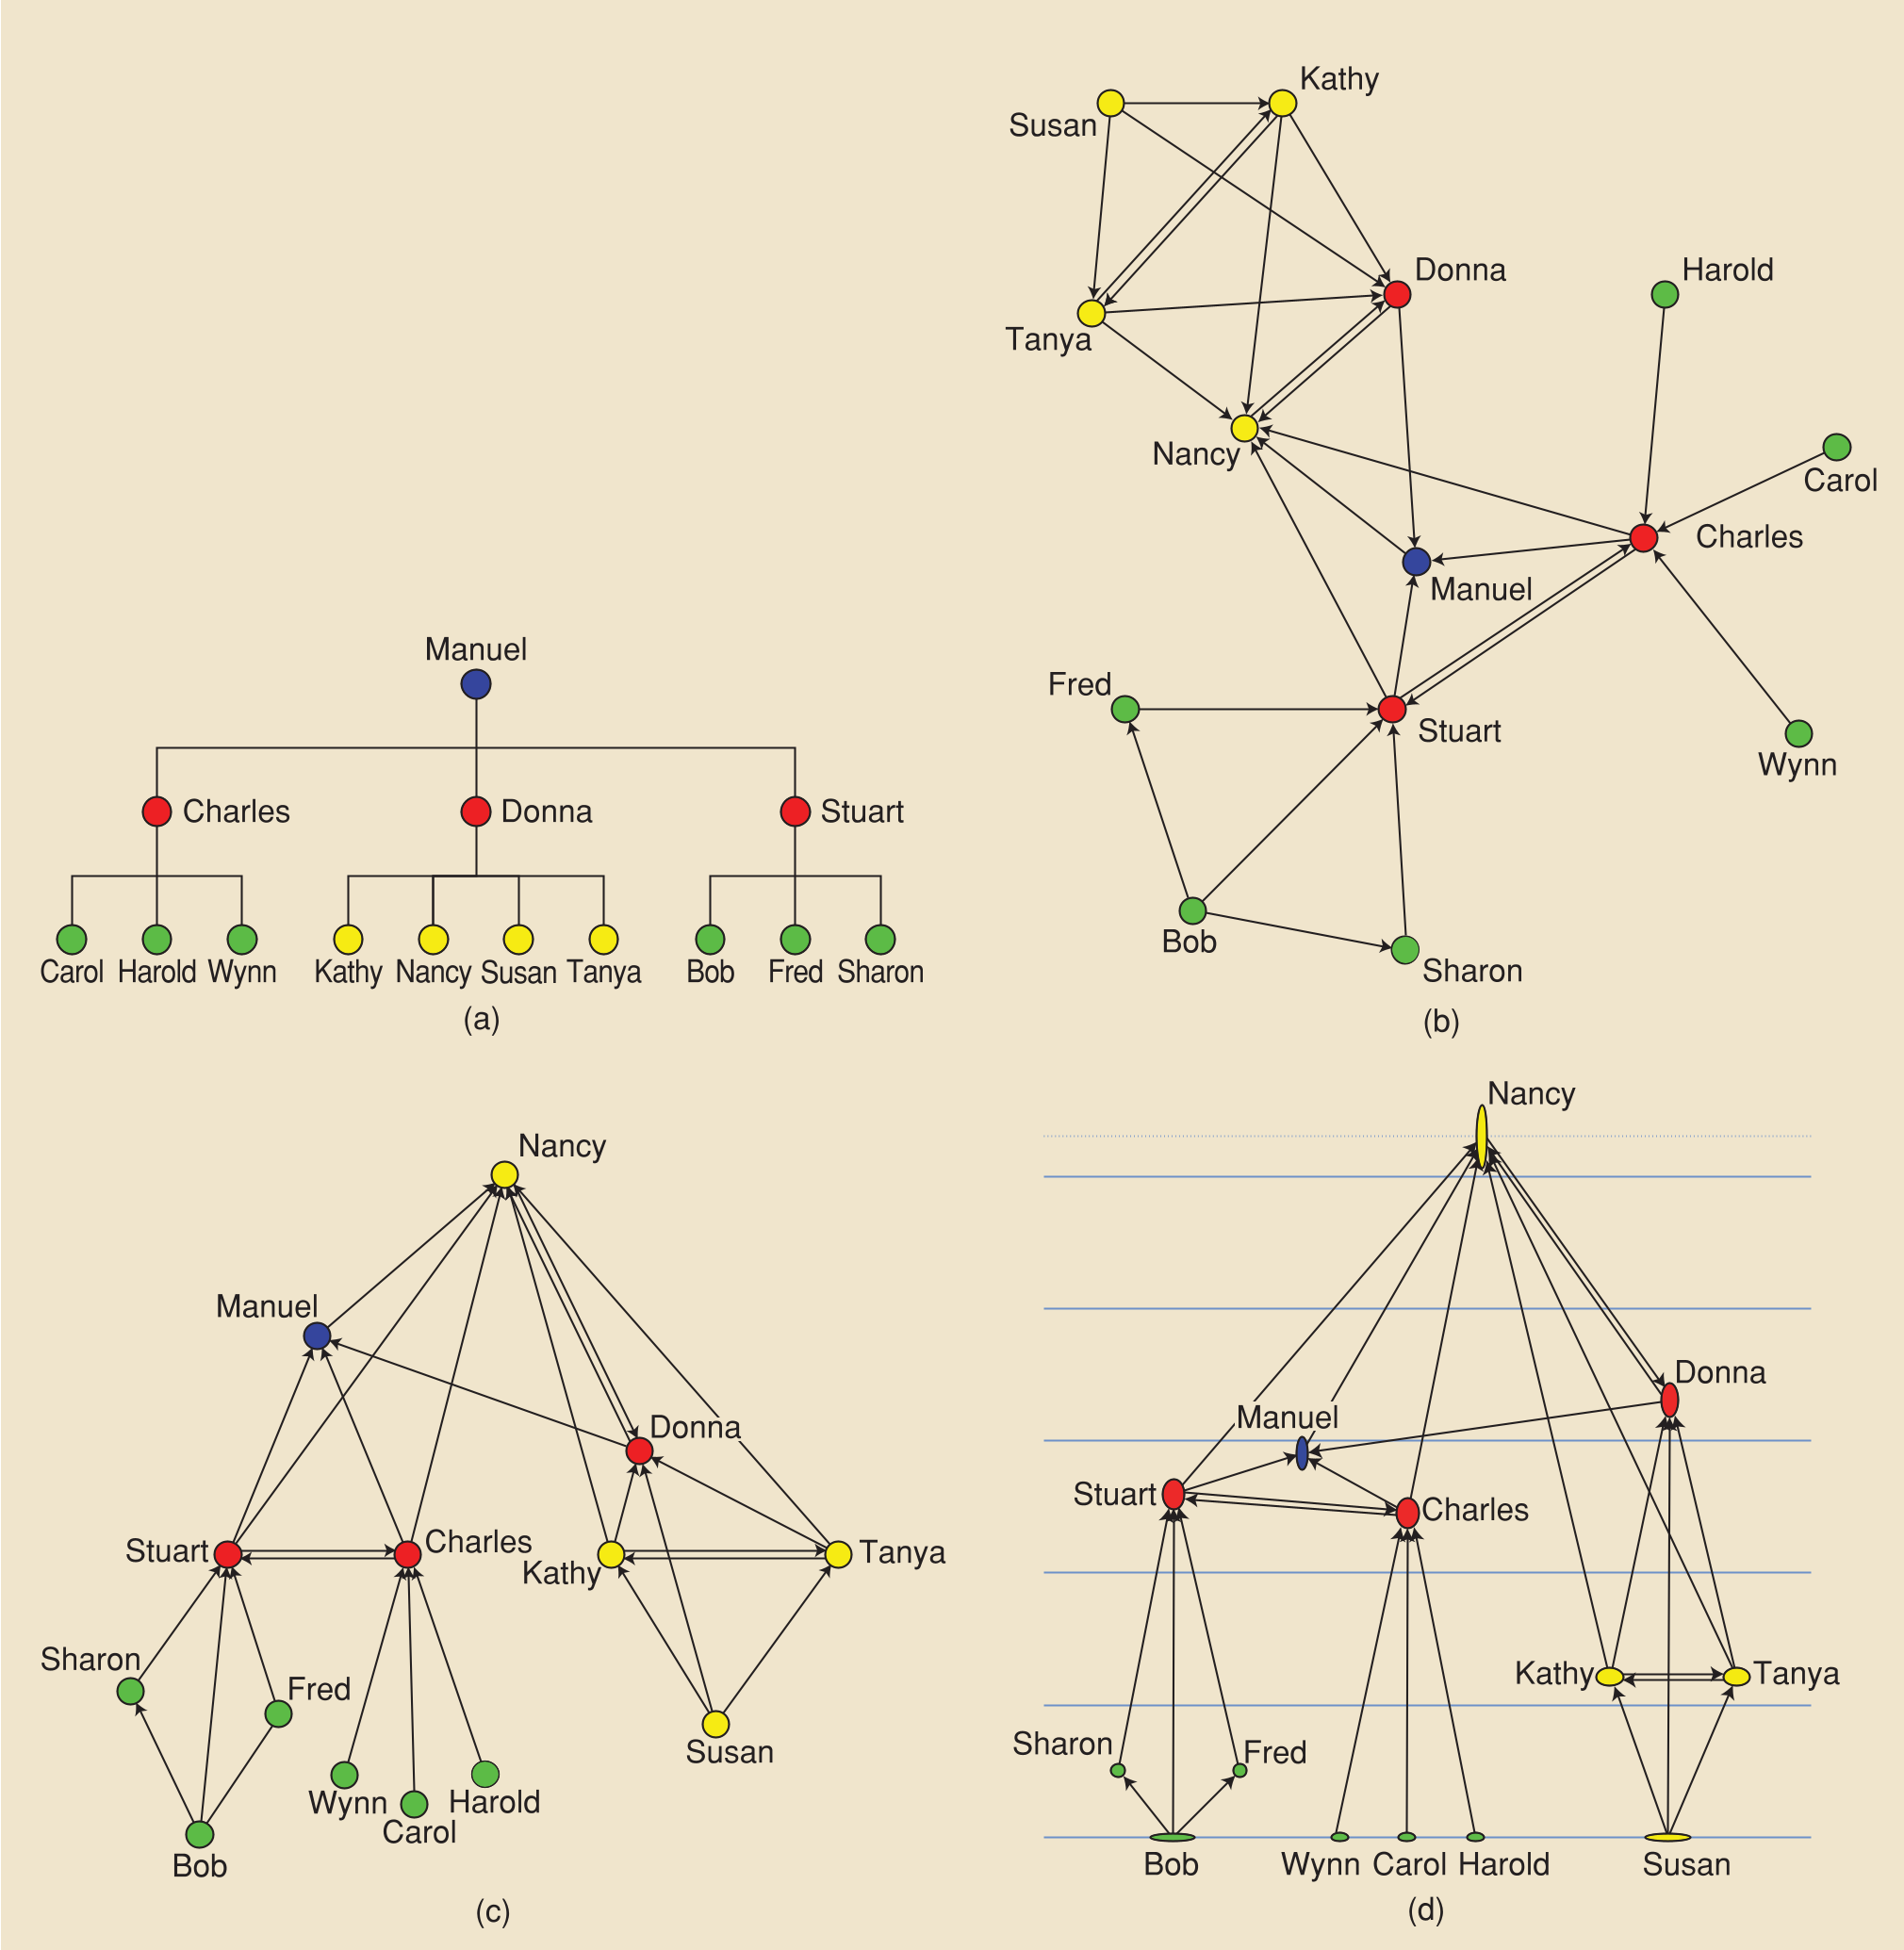 Figure 1: Comparison between formal hierarchy (a) and informal advice networks (b-d). Note how (d) uses a vertex index to determine vertical height, revealing the secretary's true status.
Experiments & Results: Visualization as Exploration
A standout insight from the paper is that visualization is an analytical tool, not just "pretty pictures."
- The Audit Unit Case Study: In a dysfunctional department, a manager's changes failed because they ignored the informal "advice network."
- Visualization Strategy: By mapping status indices to the Y-axis and minimizing edge crossings, researchers found that a secretary was the actual hub of the unit. Once the manager secured her backing, the department improved.
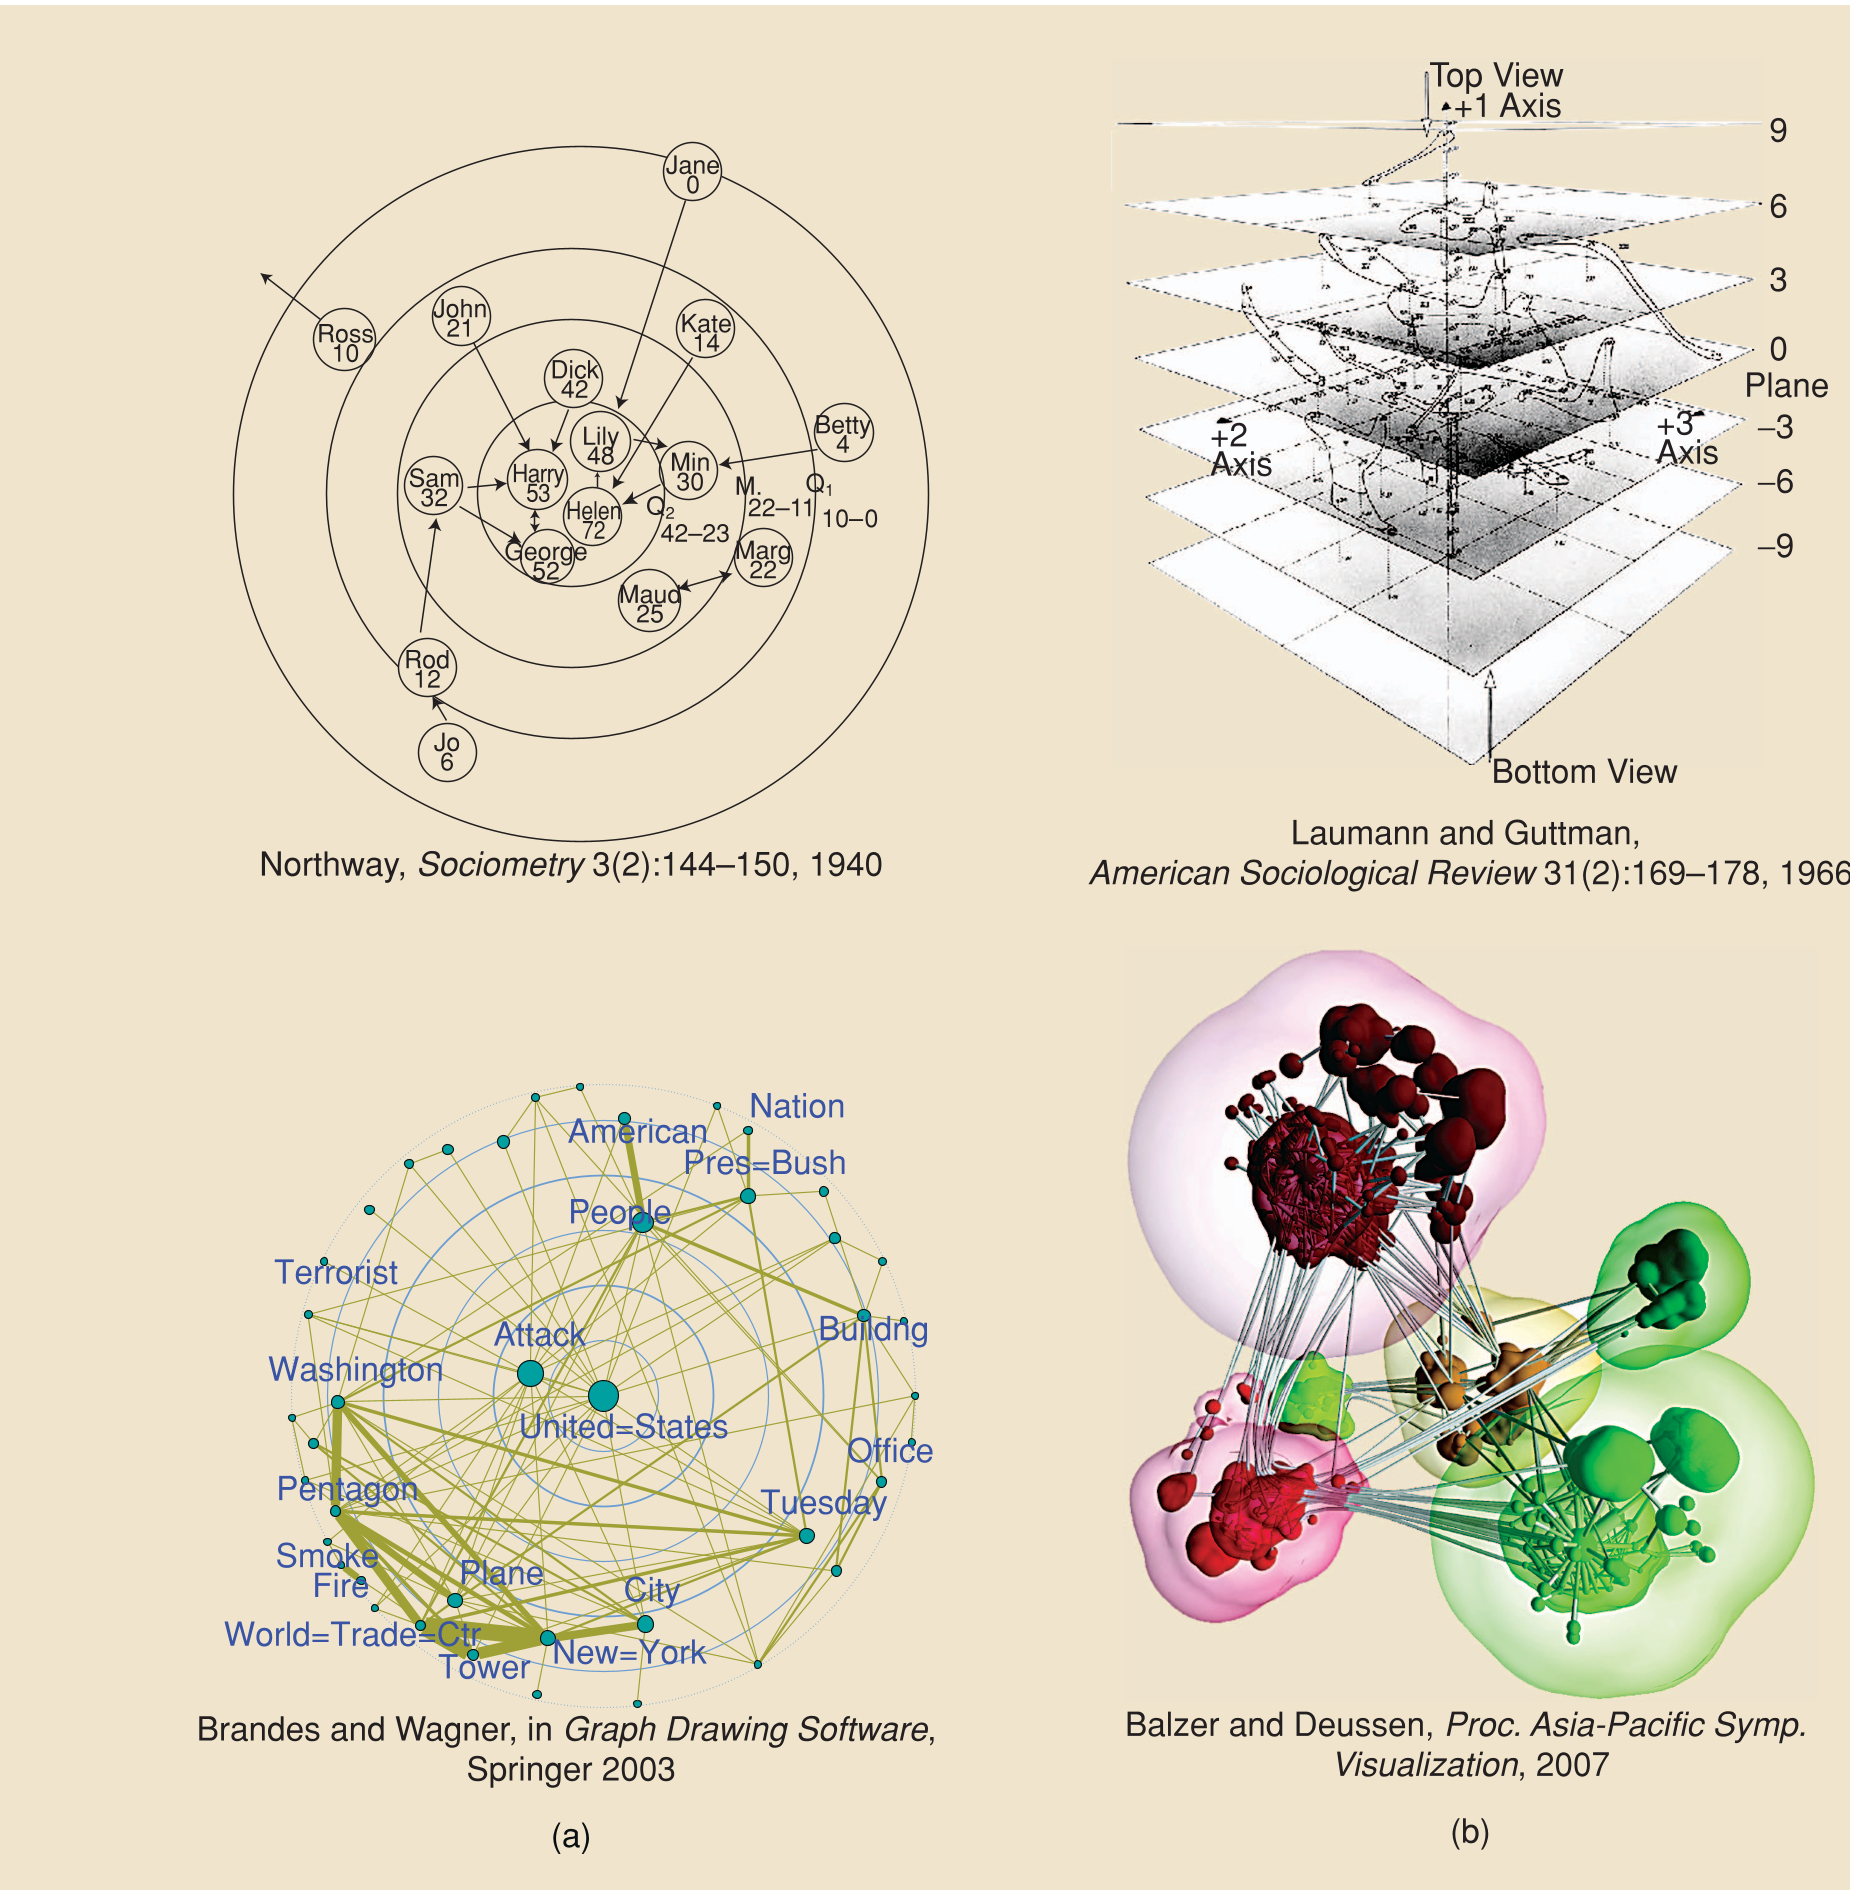 Figure 2: Tailored visual designs for (a) highlighting central actors and (b) identifying cohesive groupings.
Critical Insights & Conclusion
Takeaway
The core value of this work is the warning against "naïve phenomenological transfer." You cannot simply apply an algorithm like Closeness Centrality to any graph and expect it to mean "importance." The measure must match the actual process (e.g., is information flowing via shortest paths, or via random walks?).
Limitations
A significant portion of the most useful grouping metrics, such as Modularity Maximization or finding the Minimum Feedback Arc Set, are NP-hard. This creates a bottleneck for massive-scale networks (billions of nodes) where exact solutions are currently impossible.
Future Outlook
As the world moves toward decentralized ad-hoc networks and massive online communities, the ability to decompose and visualize these structures in real-time will be the next frontier for SNA, transitioning from static snapshots to "living" structural maps.