
Decoding the Pulse of Society: Explaining Events Through Community Evolution
Applied Mathematics and Computation
This paper introduces a framework for explaining social events by analyzing community evolution within temporal networks. By combining Generalized Hierarchical Random Graphs (GHRG) for change point detection with Group Evolution Discovery (GED), the authors map structural "shocks" in networks to specific real-world social outcomes, achieving high interpretability in complex organizational datasets like Enron and MIT Reality Mining.
TL;DR
How do you mathematically "see" a corporate bankruptcy or the start of a college semester in a massive pile of metadata? This paper presents a robust framework that treats social networks as temporal entities. By detecting structural "shocks" and analyzing how communities form, merge, or dissolve, the authors provide a lens to view social events not just as points in time, but as drivers of network topology.
The Bridge Between Math and Meaning
Complex network theory often struggles with a "semantic gap." We can measure Modularity or Centrality, but what does a sudden spike in these metrics actually mean for a company like Enron? The authors argue that the missing link is the mesostructure—the community level.
Events (like a CEO resigning or a product launch) act as external "shocks" that force the network to reorganize. By tracking these reorganizations, we can reconstruct the narrative of a social system.
Methodology: Capturing the "Shock"
The authors' workflow is designed for robustness against the inherent noise of human communication.
1. Hierarchical Modeling (GHRG)
Instead of looking at simple edges, the authors use Generalized Hierarchical Random Graphs (GHRG). This model assumes that the network is organized into a dendrogram (a tree-like structure). The deeper a node is in the tree, the higher the probability of connection. This captures the "richness" of hierarchical information.
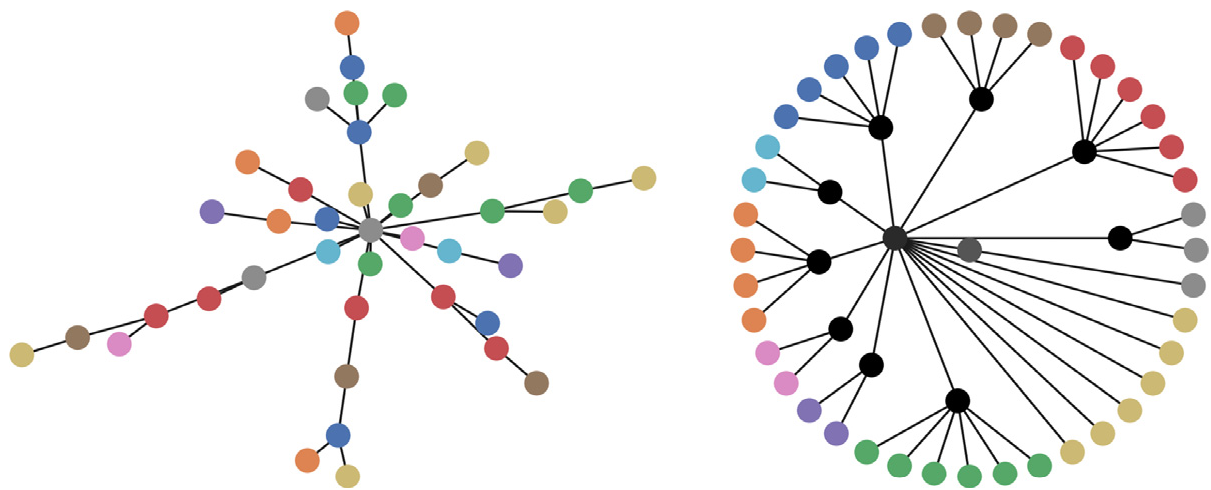 Figure 1: Comparison between a standard BA-model network and its GHRG dendrogram representation.
2. Change Point Detection
Using a Generalized Likelihood Ratio Test (GLRT), the system compares a "null model" (stable structure) against an "alternate hypothesis" (structure with a mutation). If the likelihood of the mutation is statistically significant ( threshold), a change point is marked.
3. The Seven Events of Community Evolution
Once a change is detected, the framework asks how it changed. It uses seven primitive events:
- Forming / Dissolving: Birth and death of groups.
- Continuing / Growing / Shrinking: Stability or size adjustments.
- Merging / Splitting: Fusion of multiple groups or fragmentation.
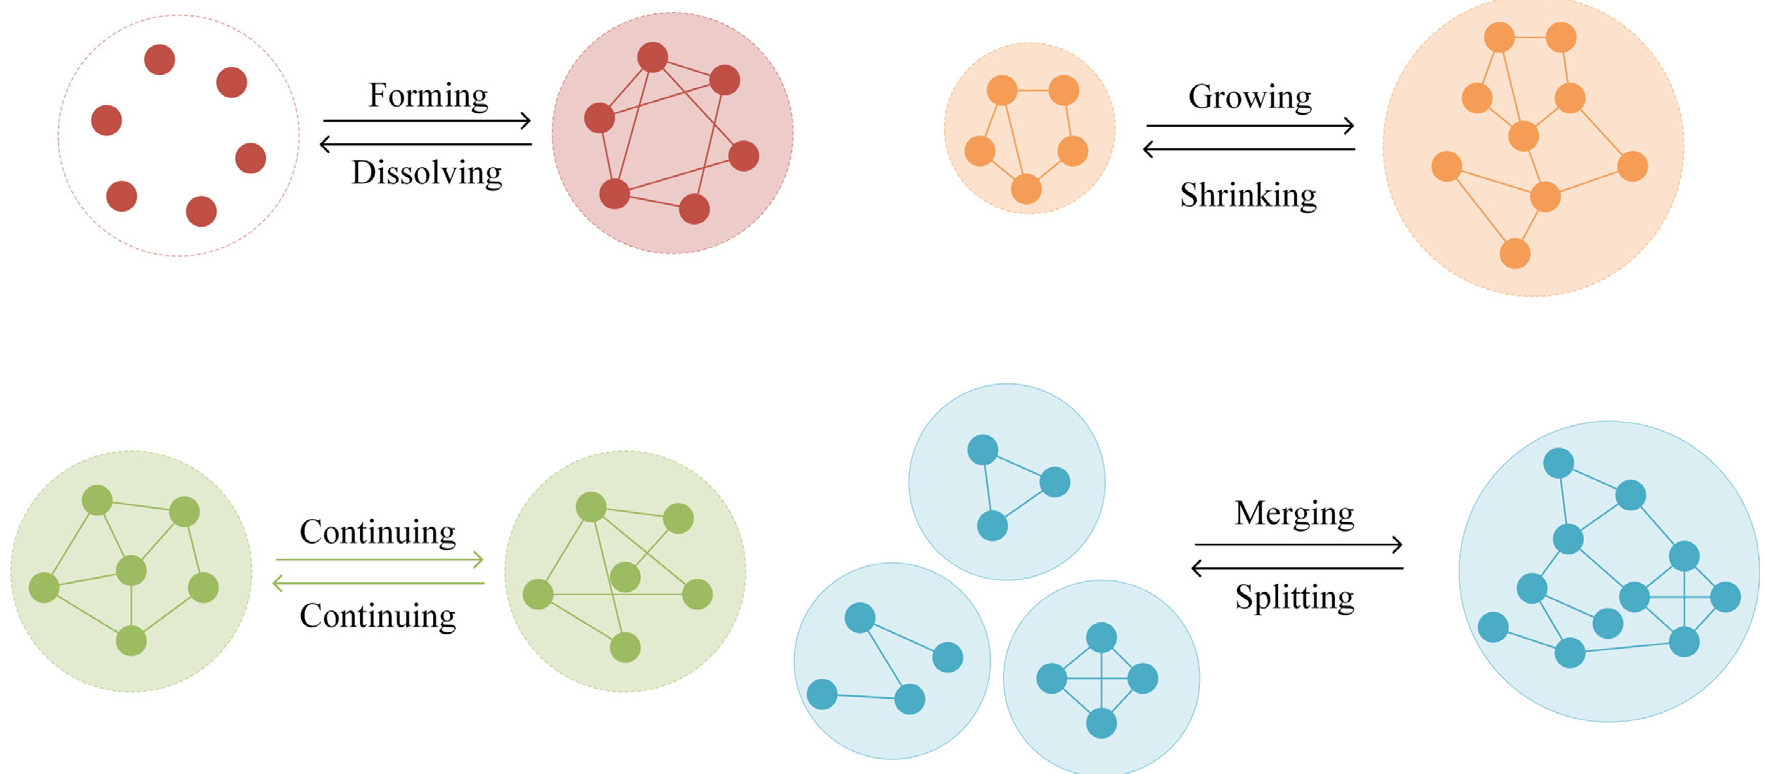 Figure 2: The seven types of community evolution events used to characterize network shocks.
Case Study 1: The Rise and Fall of Enron
The Enron email network is a "fossil record" of a corporate disaster. The study identified 11 change points that practically perfectly mirror Enron's timeline.
- Vigorousness Phase: Early stages showed high Merging and Forming events as Enron launched "EnronOnline."
- Blossom Phase: High Growing events marked the period when the stock hit an all-time high.
- Recession & Disintegration: As the SEC investigation began, the network structure shifted to Shrinking and Dissolving, reflecting the collapse of internal communication until the company filed for bankruptcy.
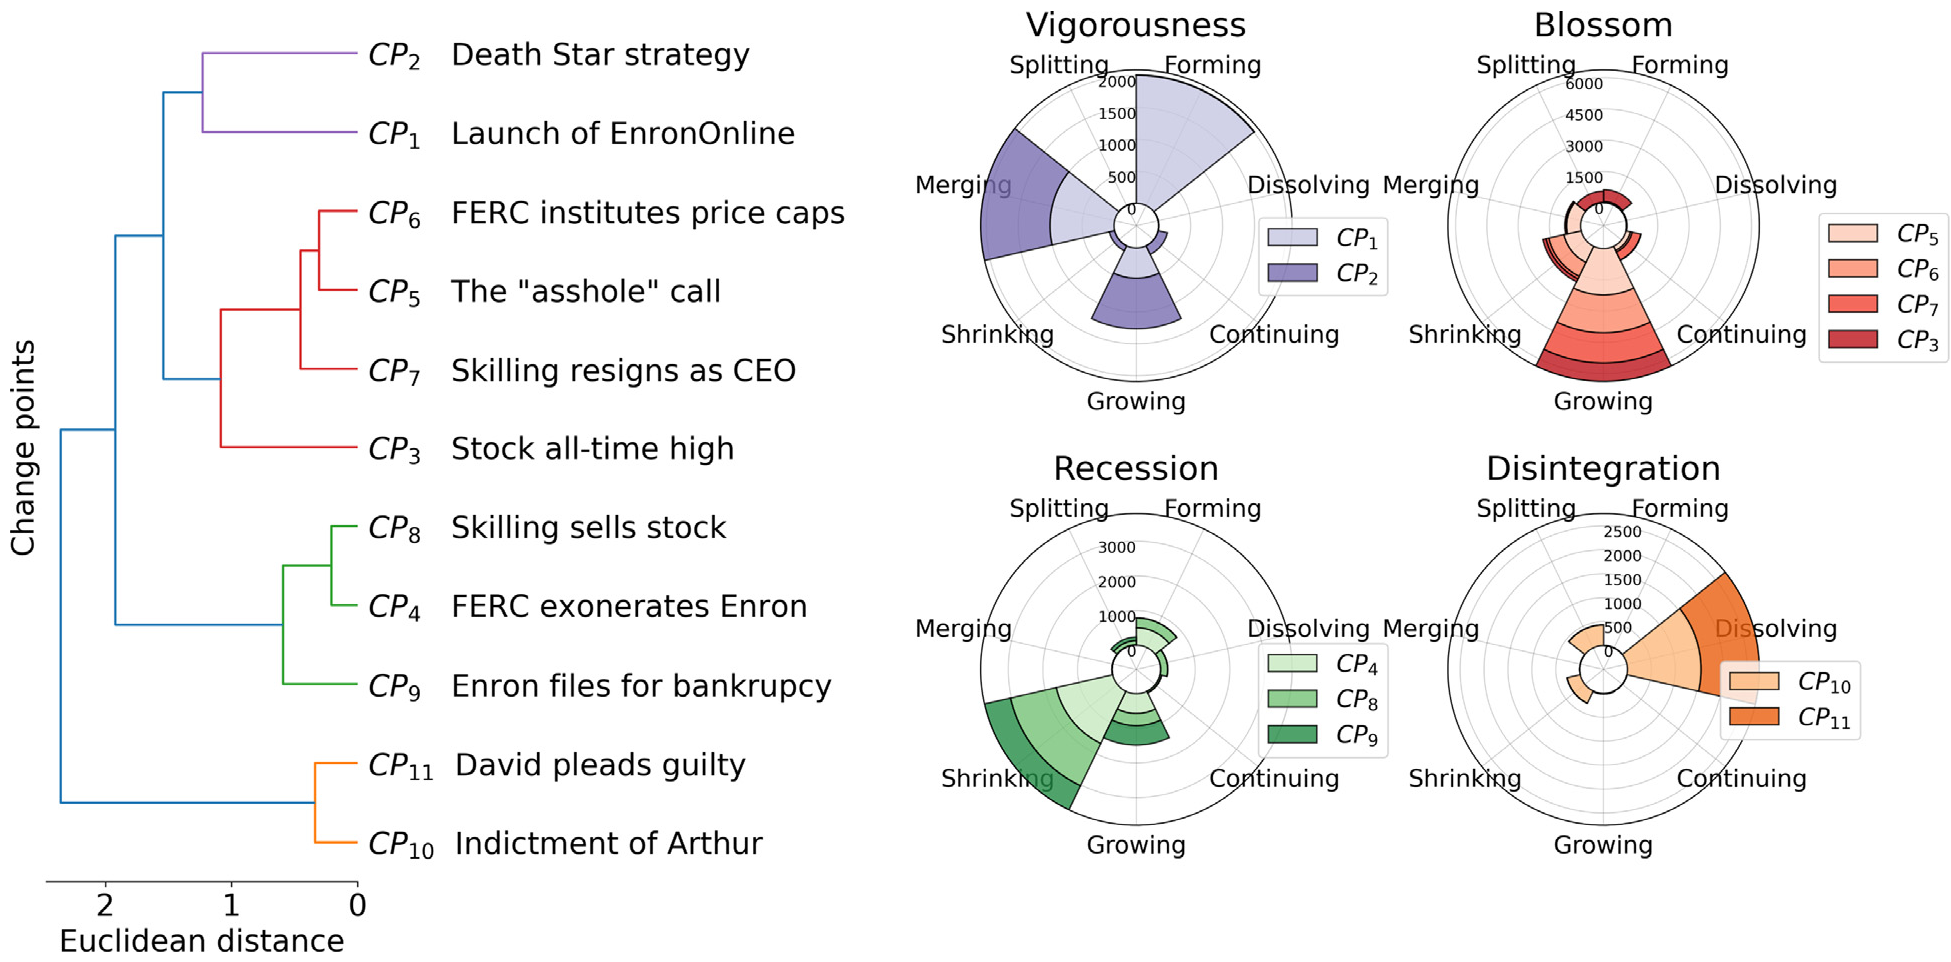 Figure 3: Hierarchical clustering of Enron's evolution, showing the transition from growth to disintegration.
Case Study 2: The Rhythm of Campus Life (MIT)
Analyzing the MIT Reality Mining data (proximity via cell phones), the framework distinguished between Academic and Vacation clusters.
- Curriculum Clusters: Dominated by Growing/Shrinking as students transitioned between classes.
- Spring Vacation: Interestingly showed a high number of Shrinking events. The authors suggest that because spring breaks are short, students often break into smaller, tighter "beach-going" or "party" pods rather than dissolving their social circles entirely.
Critical Insight: Why This Matters
The most striking takeaway is that community patterns appear in pairs. Forming and Merging typically define the early, expansionist phases of a network. Growing and Shrinking define stable, mature phases. Splitting and Dissolving signal the end of a network's lifecycle.
Limitations
While powerful, the current metrics are still somewhat "coarse." The seven community events provide a behavioral summary but may not capture the intensity or emotional valence of the communications—factors that could be vital for predicting events before they happen.
Conclusion
This research transitions network science from a descriptive tool to an explanatory one. By focusing on the "mesostructure," we can finally understand how the microscopic interactions of individuals coalesce into the macroscopic movements of history. For data scientists and sociologists alike, the message is clear: to understand the event, you must understand the evolution of the community.