
Measuring the Intangible: A Mathematical Approach to Social Capital in Collaborative Networks
An Approach to Measure Social Capital in Collaborative Networks
This paper proposes a mathematical framework and a set of indicators to measure "Social Capital" within Collaborative Networks (CNs) and Virtual organization Breeding Environments (VBEs). It combines Social Network Analysis (SNA) with resource-based views to quantify intangible assets through graph-based modeling of business contacts and shared assets.
TL;DR
In the modern business landscape, an enterprise's value isn't just about cash and hardware—it's about who they know and what they can access. This paper moves "Social Capital" from a vague sociological concept to a measurable metric for Virtual organization Breeding Environments (VBEs). By leveraging graph theory and Social Network Analysis (SNA), the authors provide a toolkit for quantifying relationship health and asset accessibility.
Problem & Motivation: The "Intangibility" Trap
When companies join long-term collaborative networks, they expect "survival benefits"—shared knowledge, niche markets, and complementary skills. However, managers often struggle to justify these partnerships because traditional accounting only tracks Economic Capital.
Social Capital—the resources embedded in and available through relationships—is notoriously difficult to measure. Prior work has been fractured between purely sociological views (prestige/trust) and economic views (resource mobilization). The lack of a rigorous, quantitative framework has prevented firms from truly optimizing their "networked" value.
Methodology: Mapping Business Synergy
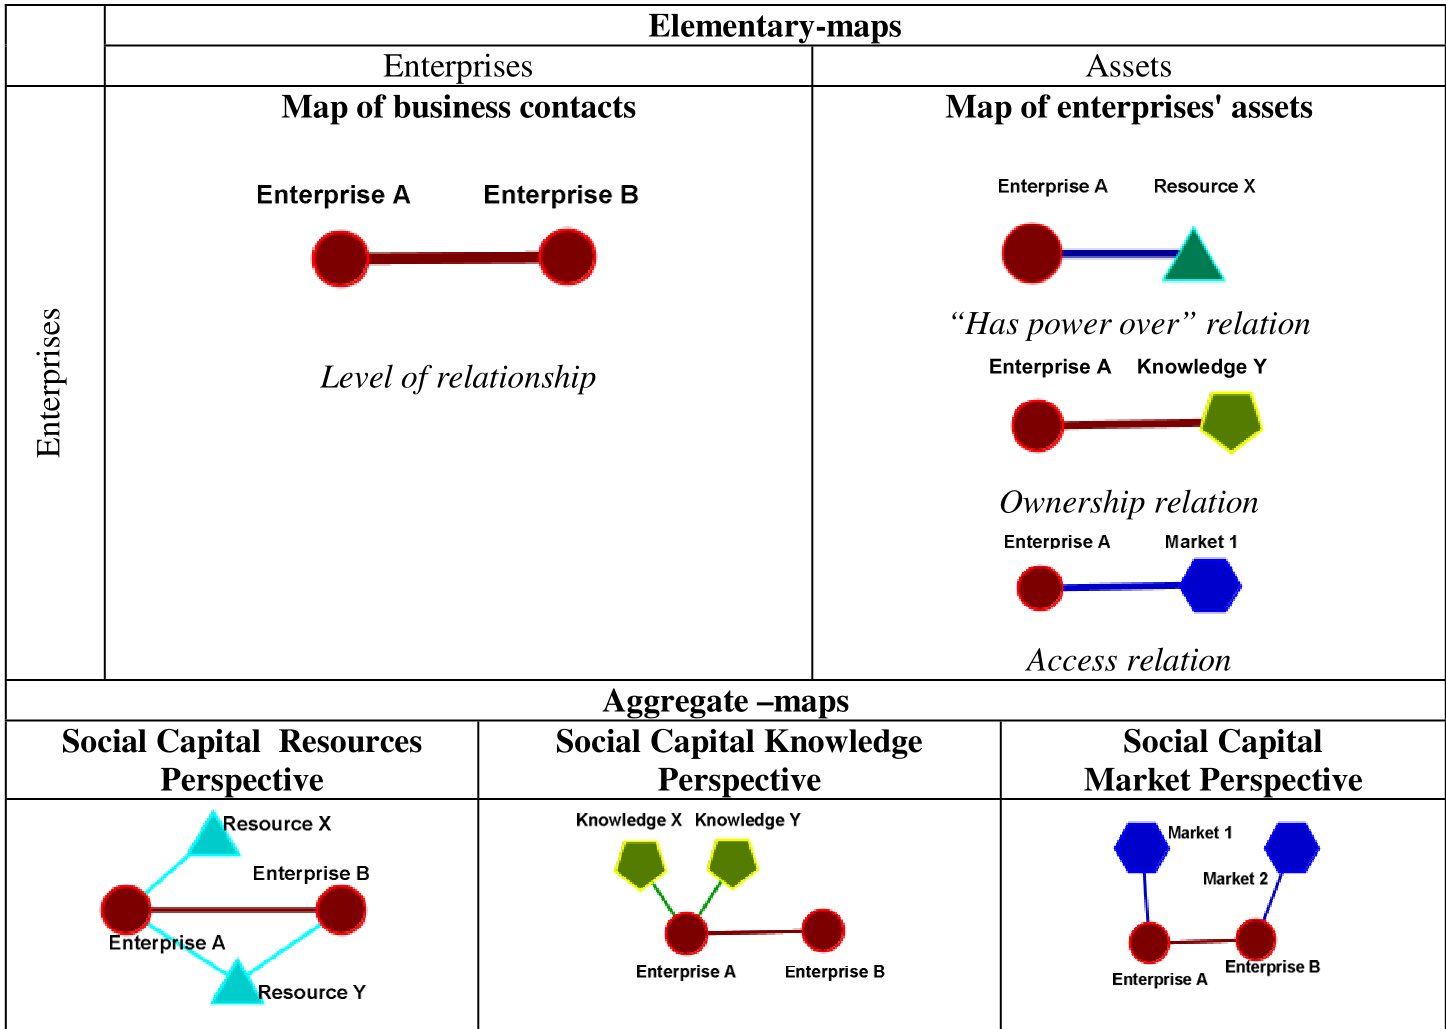
The authors propose a dual-map architecture to decompose the complexity of network interactions:
1. The Map of Business Contacts
This isn't just a simple link between nodes. The "Level of Relationship" () is calculated using a weighted formula that considers:
- Frequency and Intensity of contacts in both subordinate and peer relations.
- Value Systems Alignment (): Assessing if the two companies actually "speak the same language" in terms of goals and norms.
2. The Map of Enterprise Assets
This bipartite graph connects enterprises to the specific Assets they hold (Knowledge, Market access, Resources). By overlaying these two maps, we get a clear picture of Accessibility: Who is the "gatekeeper" of critical knowledge, and who is a "bridge" between isolated groups?
Core Metrics: From Node Degree to Accessibility
The paper introduces several specialized indicators:
- Individual Level of Accessibility (ILA): Measures a firm's efficiency in turning contacts into asset access.
- Assets Exclusivity Index (AEI): Identifies "bottleneck" resources that are owned by only one or two firms.
- Total Owned Assets Worth (TOAW): A normalized index to benchmark an enterprise's strategic value against the entire network.
Experimental Results & Visual Insight
Through a simulation of seven enterprises (E1-E7), the authors demonstrated that visibility is not influence.
While enterprises E2 and E5 had the most contacts (highest popularity), enterprise E3 held the highest accessibility. Furthermore, the model identified Enterprise E7 as a critical but potentially obstructive node: it held the most valuable/exclusive assets (like K4 and M3) but had a low "level of health" in its relationships, making those assets hard for others to reach.
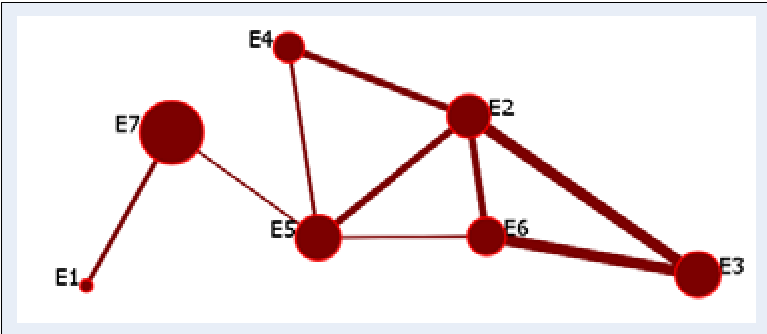 Fig 3. Visualization of asset worth (node size) and relationship strength (link width).
Critical Analysis & Conclusion
Takeaway
The framework successfully shifts the focus from "how many partners do you have?" to "how effectively can you mobilize the network's resources?" This is a vital distinction for any manager operating in a VBE or supply chain.
Limitations
- Data Collection: The model assumes we can easily measure "Frequency" and "Intensity" of contacts. In reality, gathering this data without being intrusive to daily operations ("privacy leakage") is a major technical hurdle.
- Static vs. Dynamic: The paper provides a snapshot, but social capital is highly volatile. A "health" score can plummet overnight if a key manager leaves a company.
Future Work
The authors suggest that the next frontier is developing non-intrusive monitoring systems to track these indicators in real-time, effectively creating a "Health Dashboard" for the entire collaborative ecosystem.