
Building Intelligent Eyes for Aquaculture: A WSN-Based Real-Time Monitoring Platform
Research on Building Technology of Aquaculture Water Quality Real-Time Monitoring Software Platform
This paper presents an intelligent real-time aquaculture water quality monitoring software platform developed using Wireless Sensor Networks (WSN) and the Zigbee protocol. The system integrates data fusion and data mining techniques to monitor critical indicators such as dissolved oxygen, pH, and ammonia, providing a centralized data management solution for factory aquaculture.
TL;DR
The paper introduces a comprehensive software platform designed for the factory aquaculture industry, leveraging Wireless Sensor Networks (WSN) and Zigbee protocols. By combining a custom-built embedded operating system (Z-smart) with sophisticated data mining and multi-sensor fusion techniques, the system transforms raw environmental data (pH, temperature, dissolved oxygen) into a stable, visualized, and intelligent monitoring ecosystem.
Background & Motivation: Moving Beyond Manual Sampling
Aquaculture is increasingly moving toward intensive, factory-style production. However, maintaining the delicate balance of water chemistry is often a manual or disconnected process. The primary challenge is not just collecting data, but managing it:
- Heterogeneity: Sensors from different vendors use varying formats.
- Data Noise: WSNs are prone to failure data and redundancy that drains battery and bandwidth.
- Latency: Without real-time analysis, a sudden drop in dissolved oxygen can kill a whole pond of fish before a technician notices.
The authors' insight was to move from a hardware-centric view to a data-centric view, treating the entire sensor network as a "sensing database."
Methodology: The Architecture of Intelligence
1. The Middleware: Z-smart
The heartbeat of the system is the Z-smart middleware. It acts as an abstraction layer between the underlying hardware and the upper-level applications. Its most critical role is "heterogeneous network agenting"—converting low-power Zigbee packets into standard TCP/IP data for cloud or PC-side consumption.
2. Hierarchical Structure
The platform follows a strict hierarchical design, allowing for dynamic kernel adjustment and optimized traffic flow.
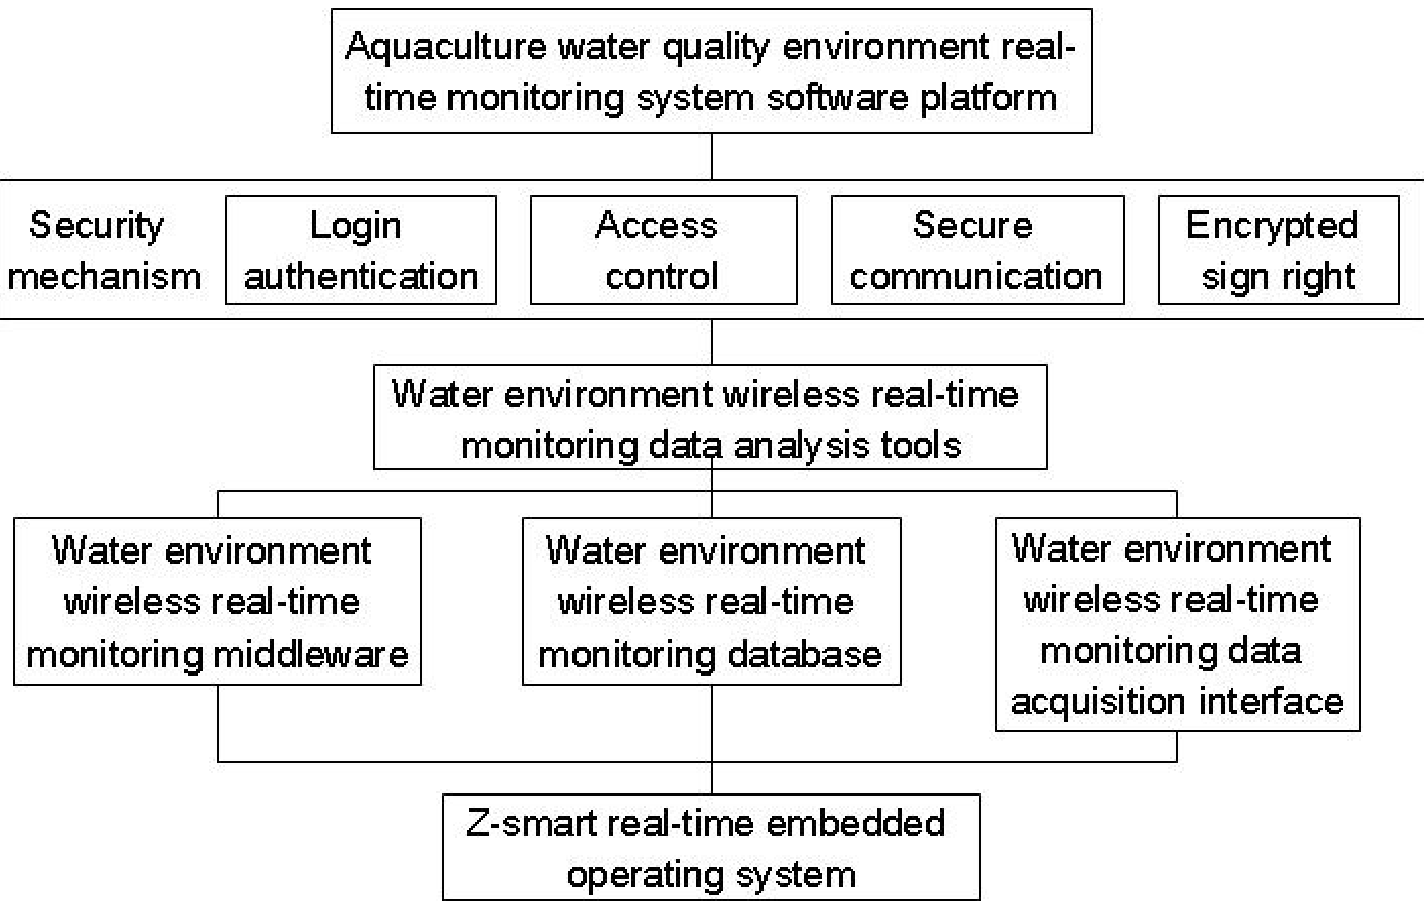 Fig 1. Logical Structure Design of the Aquaculture Monitoring Platform
3. Data Fusion & Mining
To solve the "data deluge" problem, the authors implemented a Tree Fusion Estimation algorithm. Instead of sending every single data point to the server, the nodes and relays perform a level of information abstraction. This process includes:
- Data Cleansing: Identifying and discarding failure data.
- Redundancy Reduction: Fusing overlapping data from adjacent sensors to save bandwidth.
- Status Estimation: Moving from raw numbers to higher-level "environmental health" assessments.
Visualization and Implementation
The software provides a master-slave management system where users can view the Network Topology (how nodes are communicating) and Historical Trends.
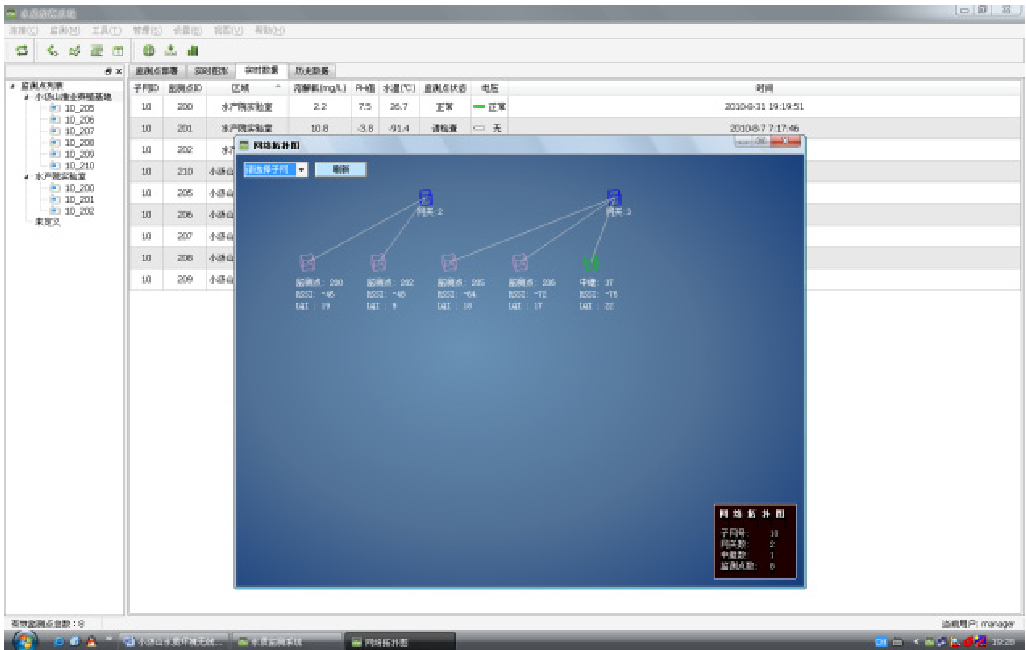 Fig 2. Visualization of the Zigbee Network Topology
One of the practical highlights is the Real-time Alarm System. Users can set thresholds for specific parameters; if the dissolved oxygen falls below 3mg/L (a typical danger zone), the dashboard turns red and triggers an SMS alert.
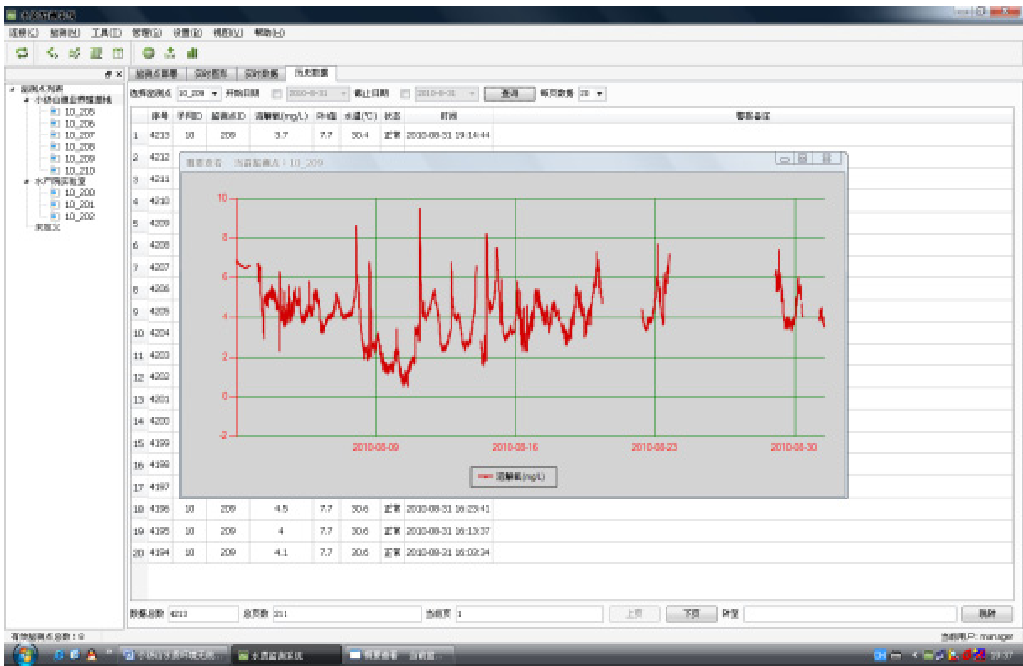 Fig 3. Historical water quality data visualization
Experimental Insights
The results confirm that the platform can:
- Lower Energy Consumption: Through decentralized information fusion.
- Increase Accuracy: By reducing interference from invalid "noise" data.
- Enhance Management: Allowing one technician to manage multiple ponds remotely via a single PC interface.
Critical Analysis & Future Outlook
While the platform is robust for its time, the reliance on VC++ and Zigbee (as described in the study) suggests it is a local-station-based solution.
- Limitations: The 802.15.4 standard (Zigbee) has a limited range compared to modern LoRa or NB-IoT technologies, which might be better for sprawling outdoor ponds.
- Future Work: Integrating Predictive Analytics. Instead of just alerting when a threshold is hit, future versions could use the "Historical Database" to predict an oxygen crash 2 hours before it happens using LSTM or other time-series models.
Takeaway
This paper serves as a blueprint for the "Information Transition" in traditional industries. The key isn't just the sensors; it's the software middleware and data fusion logic that turn "numbers" into "knowledge."