
Beyond the "Act of Faith": Quantifying the Intangible Value of AR Investments
Why one big picture is worth a thousand numbers: measuring intangible benefits of investments in augmented reality based assistive technology using utility effect chains and system dynamics
This paper proposes a quantification model for evaluating intangible benefits of Augmented Reality (AR) and smart glasses investments, specifically within the construction industry. By combining Utility Effect Chains with System Dynamics (SD), the authors provide a framework to transform qualitative improvements into monetary values for cost-benefit analyses, achieving a simulated profit increase of nearly 100% over a 10-year horizon.
TL;DR
Investing in emerging tech like Augmented Reality (AR) often feels like a gamble because traditional accounting can't easily put a price tag on "better visualization" or "safer workers." This paper bridges that gap using Utility Effect Chains and System Dynamics to turn these "soft" benefits into hard cash flow projections. In a construction industry simulation, this approach showed that AR could potentially double a firm's profit over a decade by optimizing productivity and customer reach.
The "Intangibility" Trap in Innovation
Why do companies hesitate to adopt AR despite its obvious potential? Most ROI models are built for mature technologies with decades of data. For AR—rated at a Technology Readiness Level (TRL) of only 4-6—there are no historical benchmarks.
The authors identify two core pain points:
- The Identification Gap: How do you map a site worker wearing smart glasses to a line item on a balance sheet?
- The Dynamic Gap: Benefits are not linear. Faster decision-making today leads to higher customer satisfaction tomorrow, which leads to more referrals next year. Traditional spreadsheets miss these feedback loops.
Methodology: Mapping the Causal Journey
The authors propose a structured workflow to move from technical features to financial validation.
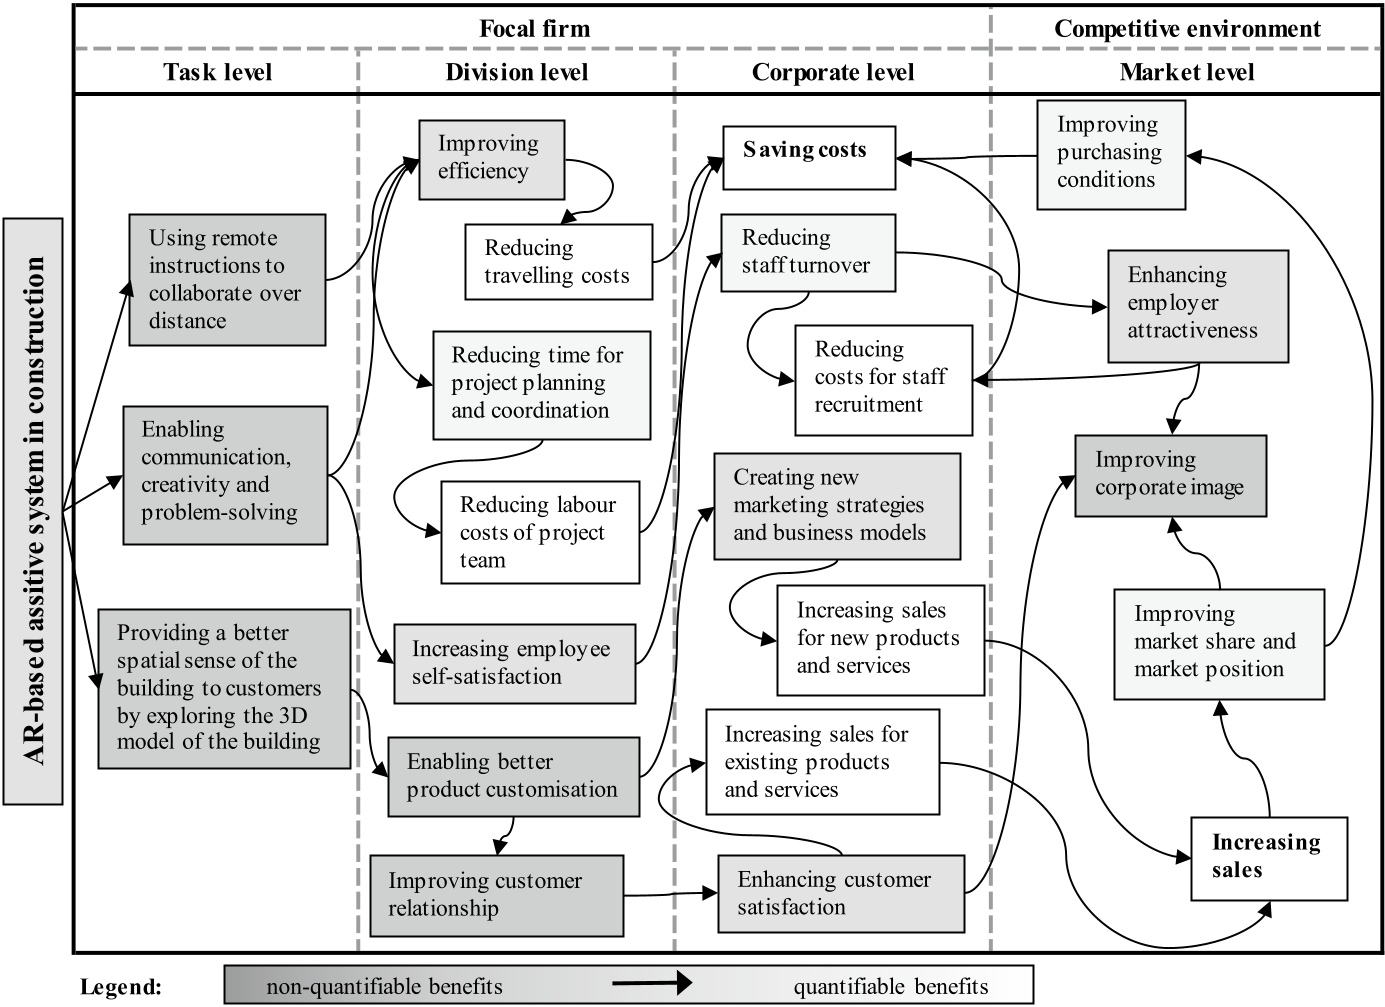
1. Utility Effect Chains (The "Why")
Instead of jumping straight to numbers, the model maps the logical flow. For example:
- Task: Remote instructions via smart glasses.
- Division Level: Reduced travel time and faster planning.
- Corporate Level: Lower labor costs and recruitment savings.
- Market Level: Improved corporate image and "first-mover" advantage.
2. System Dynamics (The "How")
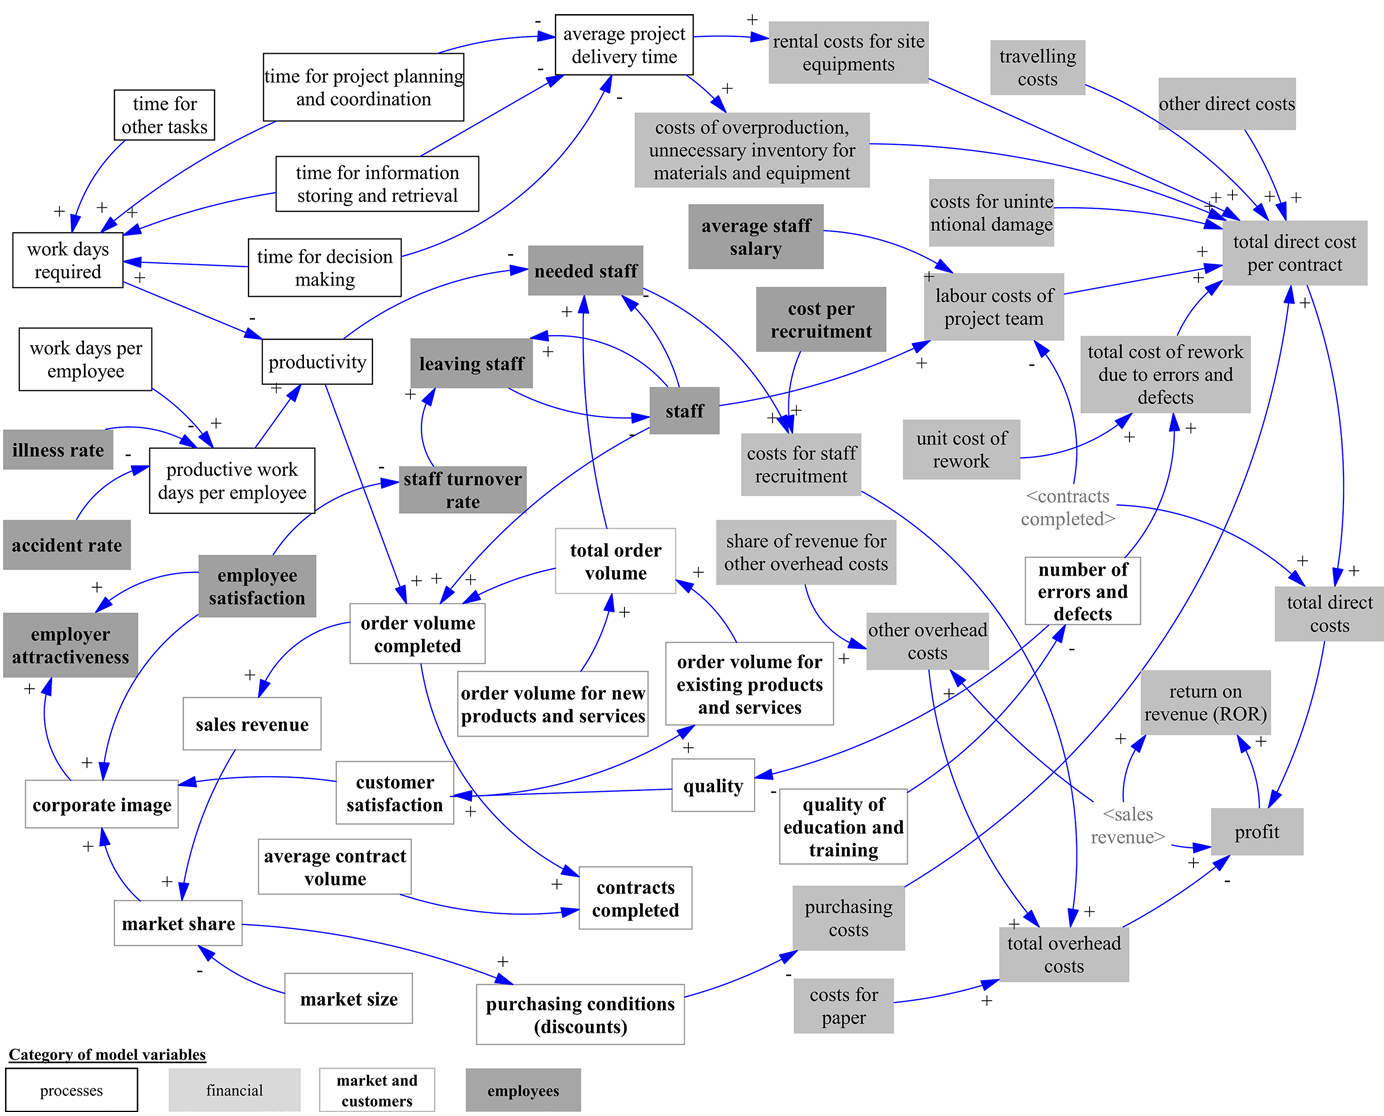
To handle the complexity, the authors used System Dynamics (SD). Unlike a static ROI formula, SD models the company as a living organism with feedback loops. Reducing errors doesn't just save money on "rework"; it boosts quality, which drives customer satisfaction, which increases future order volume.
Evidence: The 10-Year Outlook
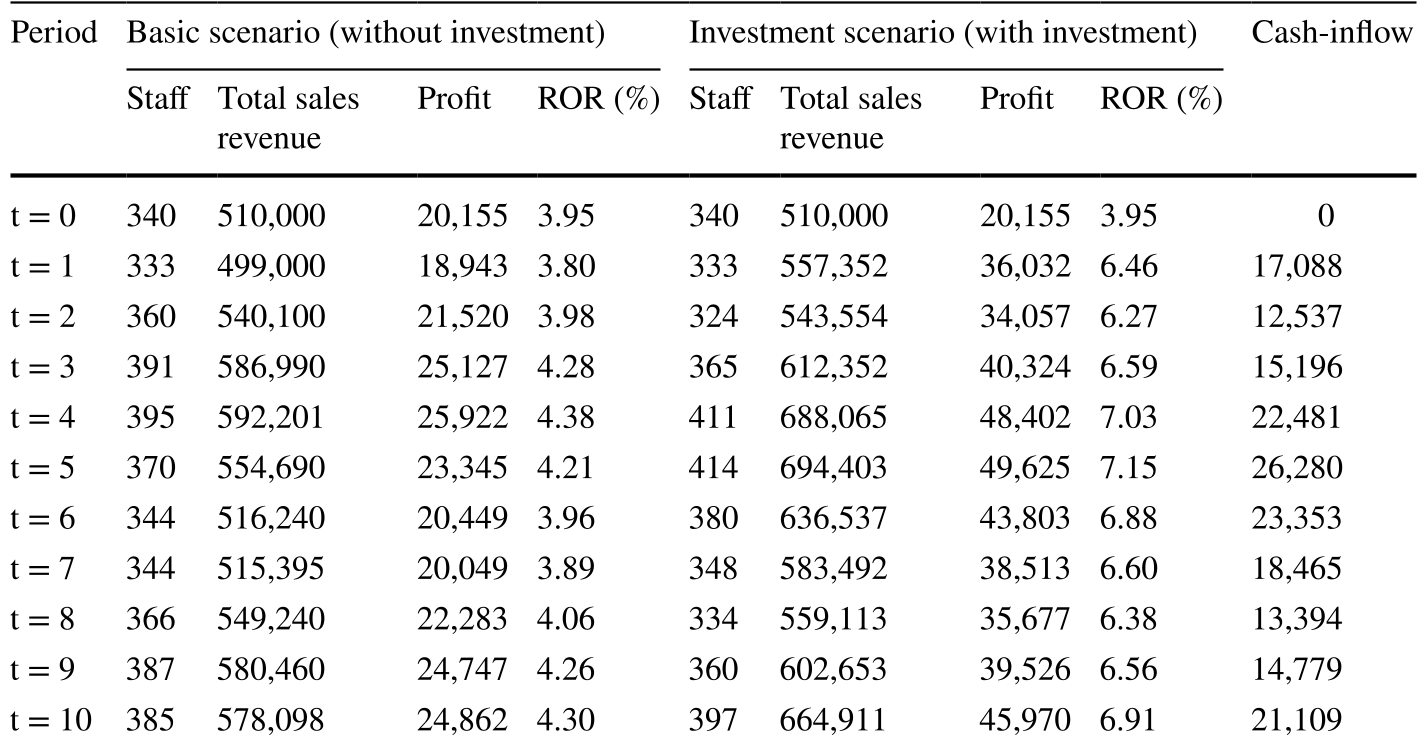
The study compared a "Basic Scenario" (status quo) against an "Investment Scenario" (AR adoption) for a construction firm with 340 employees.
- Revenue Growth: The AR scenario saw total sales grow by roughly 87 million € more than the baseline by Year 10.
- Profitability: The Return on Revenue (ROR) nearly doubled, jumping from ~4% to ~7%.
- Efficiency: The model showed that even if the workforce stayed stable, productivity gains allowed the company to handle a much larger volume of complex contracts.
Critical Insight: The "Rebound Effect" Warning
A standout contribution of this paper is the mention of rebound effects. The authors wisely note that saved time doesn't always equal saved money—sometimes workers simply fill the "saved" time with other non-productive behaviors. Future models must account for these psychological shifts to avoid over-optimistic projections.
Conclusion: From "Faith" to "Foresight"
This research moves the needle for CTOs and CFOs. By providing a "Big Picture" (the utility chain) supported by a "Simulation Engine" (System Dynamics), firms can finally evaluate innovative tech like AR with the same rigor as a new factory or fleet. While the data used was artificial, the framework is a ready-to-use blueprint for any firm looking to justify the next leap in Industry 4.0.