
ASD Detection in Children: Optimizing Early Intervention with Machine Learning
Detection of Autism Spectrum Disorder in Children Using Machine Learning Techniques
This paper presents a machine learning-based approach for the early detection of Autism Spectrum Disorder (ASD) in toddlers using the Q-CHAT-10 screening tool. By evaluating five distinct classifiers (LR, NB, SVM, KNN, and RFC) on a specialized dataset, the authors identify Logistic Regression as the superior model for streamlining clinical diagnosis.
TL;DR
Autism Spectrum Disorder (ASD) impacts roughly 1% of the global population, yet diagnosis remains a bottleneck due to lengthy clinical evaluations. This study benchmarks five machine learning models—Logistic Regression, Naive Bayes, SVM, KNN, and Random Forest—using the Q-CHAT-10 screening dataset. The result? Logistic Regression (LR) emerges as the gold standard for this scale of data, achieving 97.15% accuracy, offering a pathway to significantly reduce diagnostic wait times.
Problem & Motivation: The 13-Month Bottleneck
The "golden window" for ASD intervention is within the first two years of life. However, current diagnostic methods like ADI-R are often subjective and face a steep supply-demand imbalance in pediatric clinics. This results in an average wait time of 13 months from initial concern to diagnosis.
The authors' insight is grounded in computational efficiency: by transforming behavioral attributes from the Q-CHAT-10 checklist into machine-readable features, we can complement conventional methods with an automated, high-precision risk assessment tool.
Methodology: The Core Architecture
The workflow follows a classic yet robust pipeline: Preprocessing -> Feature Engineering -> Model Training -> Performance Evaluation.
Data Strategy
- Preprocessing: Removing non-contributing noise (e.g., 'Case No') and handling missing values.
- Encoding: Applying Label Encoding for binary traits (Sex, Jaundice) and One-Hot Encoding for high-cardinality features like 'Ethnicity' to prevent the model from assuming a false hierarchy among groups.
- Thresholding: The target variable was derived from a Q-CHAT-10 score > 3, marking potential ASD traits.

Algorithm Selection
The study evaluated five models with varying inductive biases:
- Logistic Regression (LR): Optimal for binary classification and small datasets.
- Naive Bayes (NB): Leverages conditional independence; fast but risky if features are correlated.
- Support Vector Machine (SVM): Uses an RBF kernel to find the maximum-margin hyperplane.
- K-Nearest Neighbors (KNN): A distance-based approach (Euclidean).
- Random Forest (RFC): An ensemble method of decision trees.
Experiments & Results
The comparison revealed a clear hierarchy in model performance. Logistic Regression dominated the field, likely because the relationship between the Q-CHAT-10 features and the diagnosis is largely linear in the transformed feature space.
Performance Metrics (Table 4)
| Model | Accuracy | F1-Score | Confusion Matrix [TN, FP, FN, TP] |
|---|---|---|---|
| Logistic Regression | 97.15% | 0.98 | [57, 5, 1, 148] |
| Naive Bayes | 94.79% | 0.96 | [56, 6, 5, 144] |
| SVM | 93.84% | 0.95 | [52, 10, 3, 146] |
| RFC | 81.52% | 0.88 | [45, 17, 14, 135] |
The Precision-Recall curves below illustrate the stability of the LR model across different probability thresholds compared to SVM.
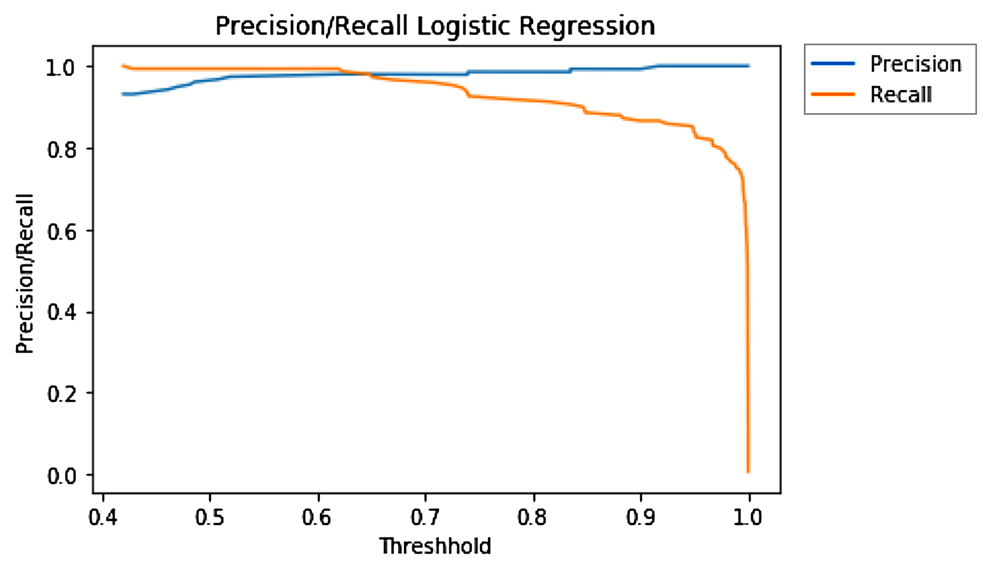 Fig 1: Logistic Regression shows a high Area Under the Curve, indicating robustness.
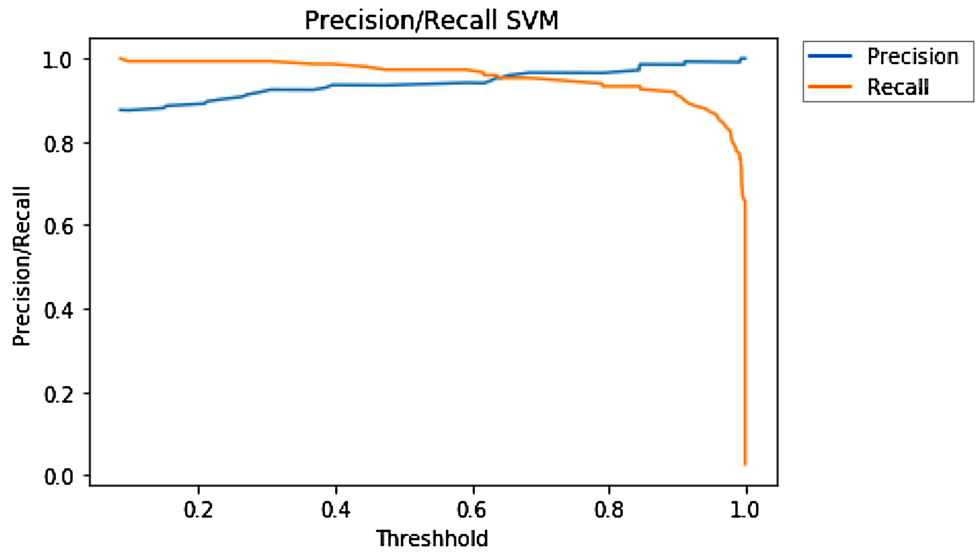 Fig 2: SVM, while accurate, shows more sensitivity to threshold variations.
Demographic Insights
- Age factor: ASD detection peaks around 36 months, confirming that behavioral traits become most identifiable by age 3.
- Gender bias: The dataset confirms higher prevalence in males, a trend widely observed in ASD clinical research.
Critical Analysis & Conclusion
While the results are impressive, the study faces a common machine learning hurdle: dataset size. 1,054 instances are sufficient for classical models but insufficient for the deep learning (CNNs) the authors propose for future work. Furthermore, the reliance on Q-CHAT-10 scores as the ground truth creates a potential circularity—the model is essentially learning to replicate the Q-CHAT logic rather than "discovering" new clinical markers.
Takeaway: This research successfully demonstrates that "less is more." When clinical data is scarce and binary categorical features are predominant, Logistic Regression provides the most reliable and interpretable baseline for medical screening tools.
Future Outlook: The integration of multimodal data (e.g., combining Q-CHAT-10 with facial emotion analysis via CNNs) could lead to an even more nuanced and objective diagnostic system.