
Monitoring Guangxi’s Changing Topography: A 20-Year Remote Sensing Analysis of Agricultural Land
Application of Background Information Database in Trend Change of Agricultural Land Area of Guangxi
This paper presents a long-term remote sensing analysis of agricultural land changes in Guangxi, China, using a multi-temporal Landsat ETM/TM dataset from 1988 to 2008. By integrating ENVI-based supervised classification with human-computer interaction, the study established a comprehensive background information database to track multi-class land cover transformations.
TL;DR
This study leverages two decades of Landsat imagery (1988–2008) to quantify the decline of agricultural land in Guangxi, China. By fusing spectral classification (ENVI) with manual refinement (GIS), the researchers achieved classification accuracies of up to 92%, documenting a loss of over 700 km² of farmland due to urbanization.
The Challenge: Spectral Confusion in Complex Terrains
Guangxi is a region characterized by diverse topography and areas of serious desertification. Protecting arable land is not just an environmental concern but a prerequisite for national food security. The core technical hurdle lies in the spectral similarity between different vegetation types (forest vs. farmland) and the challenge of identifying "background information"—shrub, grass, urban roads, and water—across varying satellite sensors (TM vs. ETM+).
Methodology: Human-in-the-Loop Spectral Analysis
The researchers utilized a hybrid approach that moved beyond simple "black-box" classification.
1. Spectral Fingerprinting
The study focused on the physical properties of light reflection:
- Band 4 (NIR): Extremely sensitive to the cellular structure of leaves, used to distinguish lush vegetation from barren or urban areas.
- Band 5 (SWIR): Used to measure moisture content. Forests and healthy farmland appear darker (low reflectance) due to water absorption, while urban "dry" surfaces appear bright.
2. The Processing Pipeline
The workflow involved a rigorous pre-processing stage (Atmospheric and Geometric correction) followed by a hierarchical classification:
- Supervised Classification: Training samples were selected based on the spectral curves of target objects.
- Human-Computer Interaction: Automated results were refined manually to eliminate misclassifications between roads, towns, and rocky areas.
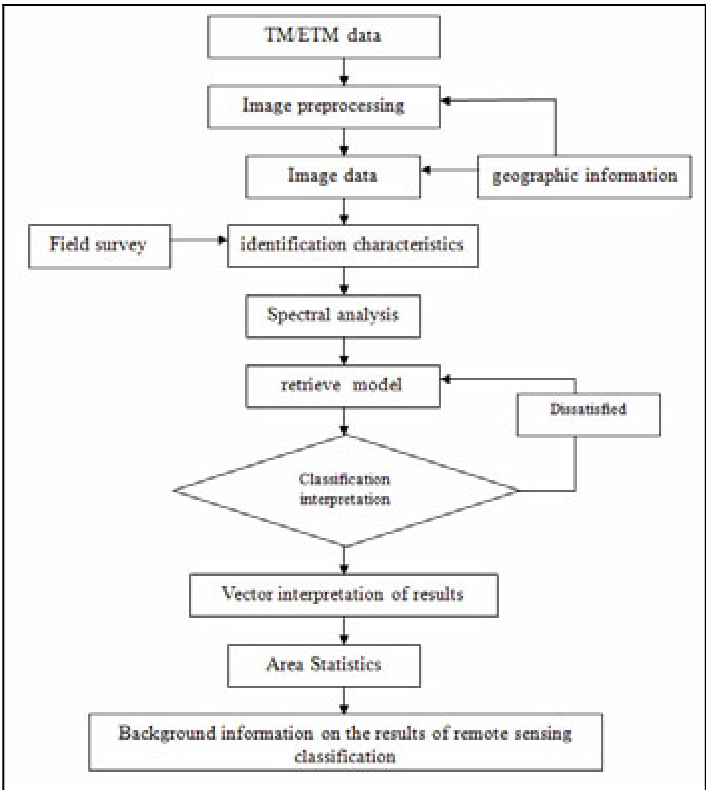 Figure 1: The technical workflow from image acquisition to trend analysis.
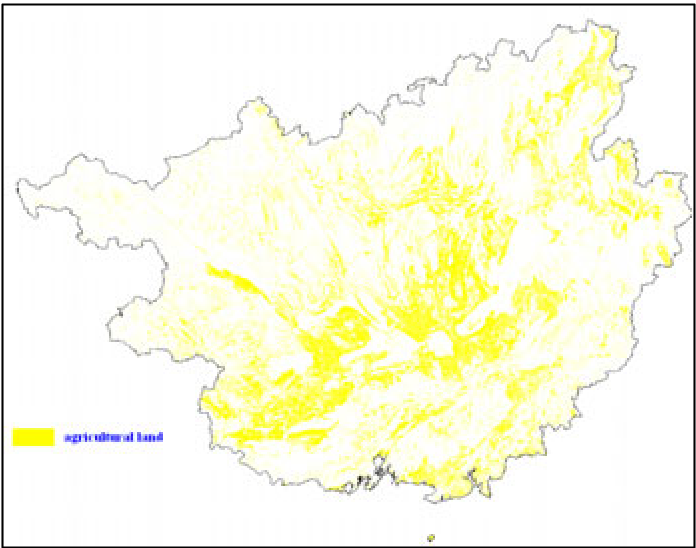 Figure 2: Spectral signature analysis for different land covers used to train the classifier.
Results and Evolutionary Trends
The study successfully mapped the distribution of agricultural land with an accuracy of 88.09%. The high accuracy for surface water (92.86%) suggests the model is particularly robust at separating wet vs. dry features using the SWIR bands.
| Land Class | Survey Points | Correct | Accuracy (%) |
|---|---|---|---|
| Surface Water | 28 | 26 | 92.86 |
| Agricultural Land | 42 | 37 | 88.09 |
| Forest | 26 | 22 | 84.62 |
The longitudinal data (1988–2008) indicates a clear downward trend in agricultural surface area. Specifically, the total area shrank by 732.8 km². While the researchers describe this change as "not very significant" in percentage terms relative to Guangxi's massive total area, the motivation is clear: rapid economic development and infrastructure expansion are encroaching on traditional farming zones.
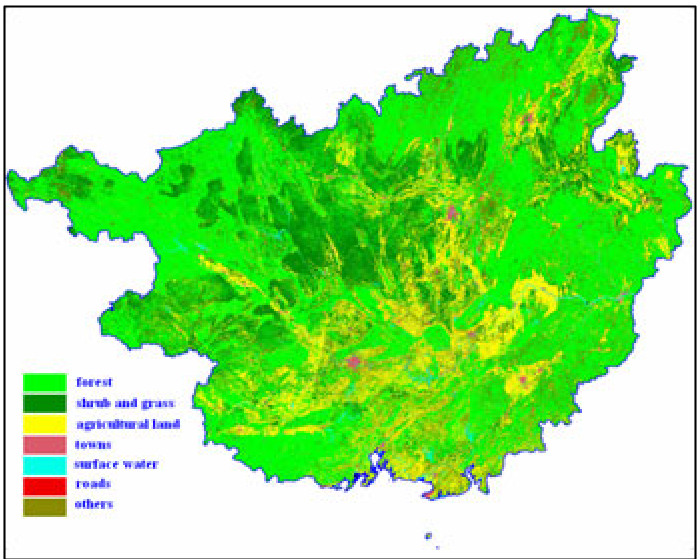 Figure 3: Visualized classification results showing the extent of agricultural land.
Critical Insight & Conclusion
The value of this work lies in its ground-truthing. By conducting extensive field surveys (as shown in the itinerary maps), the researchers validated that "background information" spectral models remain relevant even as automated AI models emerge.
Takeaway: The study proves that human-computer interaction is still a vital "sanity check" in remote sensing. For future researchers, the focus should shift toward how these background databases can be integrated with real-time satellite feeds to provide early warnings for illegal land conversion or encroaching desertification.
Limitations: The study primarily uses 30m resolution data. With today’s 10m (Sentinel-2) or sub-meter commercial imagery, the "human interaction" part of this workflow could be significantly automated through Convolutional Neural Networks (CNNs) while maintaining the same spectral logic established here.