
BCRAM: Redefining Cancer Risk Assessment via Medical Social Networks
BCRAM: A Social-Network-Inspired Breast Cancer Risk Assessment Model
The paper introduces BCRAM, a Social-Network-Inspired Breast Cancer Risk Assessment Model specifically optimized for the Chinese population. By shifting from genetic testing to epidemiological factor similarity, the model achieves a SOTA AUC of 0.785 using a medical social network construction and community discovery approach.
Executive Summary
TL;DR: Traditional cancer risk assessment often falls into two traps: being too expensive (genetic models) or too rigid (mathematical statistical models like Gail). Researchers have now introduced BCRAM (Breast Cancer Risk Assessment Model), a framework that treats a patient’s epidemiological profile as a "social footprint." By building a medical social network and grouping individuals based on factor similarity rather than just raw probability, BCRAM delivers a massive leap in accuracy for the Chinese population.
Background Positioning: This paper marks a shift from purely statistical regression toward network-based epidemiology. It is a crucial local adaptation for China, providing a cost-effective screening tool for high-population densities where mass DNA testing is unfeasible.
The Problem: Why Classic Models Fail in New Geographies
For decades, the Gail Model has been the gold standard for predicting breast cancer risk. However, its accuracy plummets when applied to non-Western populations. The reasons are two-fold:
- Heterogeneous Pathogenesis: Risk factors in China (e.g., rapid lifestyle shifts, dietary habits) differ from those in the US.
- The "Fixed Equation" Trap: Most models use static coefficients. If a region doesn't fit the predetermined weights, the model becomes useless.
The authors argue that we shouldn't be looking for a universal formula, but rather for similarity clusters. If a healthy woman's physiological and lifestyle profile (age at menarche, BMI, life satisfaction) closely mirrors that of confirmed patients, she belongs in a high-risk group.
Methodology: People as Nodes, Similarity as Edges
The core innovation of BCRAM is the Medical Social Network. Instead of calculating a single risk score, the model builds a graph where:
- Nodes: Represent individual women (both healthy and patients).
- Edges: Represent the similarity () between their Related Risk Factors (RRFs).
The Similarity Function
The model uses a normalized absolute difference to calculate similarity for each factor:
Group Division via Modularity
Once the network is built, the algorithm partitions it using Modularity (Q) optimization. It iteratively moves nodes between Group A (high risk) and Group B (low risk) to maximize the "tightness" of the connections. Unlike traditional supervised learning, this approach discovers the natural structure of risk within the population.
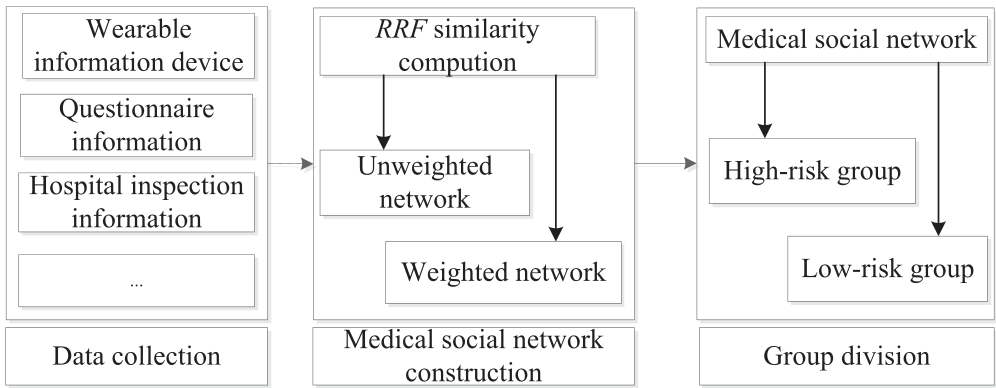 Figure 1: The architecture of BCRAM showing the flow from data collection to group discovery via medical social networks.
Experiments: Superior Predictive Power
The researchers tested BCRAM against four major benchmarks: Gail, Modified Gail, Tyrer-Cuzick, and the Liu-Yu model.
1. The Power of 8 Factors (RRF8)
Through ablation-like testing (Test 1), the authors found that including 8 specific factors (including family history, BMI, and even current life satisfaction) provided the optimal ROC curve. Adding more factors beyond this resulted in diminishing returns.
2. SOTA Visualized
In a direct head-to-head comparison, BCRAM dominated.
- BCRAM AUC: 0.785
- Liu-Yu AUC: 0.722
- Tyrer-Cuzick AUC: 0.694
- Gail AUC: 0.574 (Significant underperformance in the Chinese cohort)
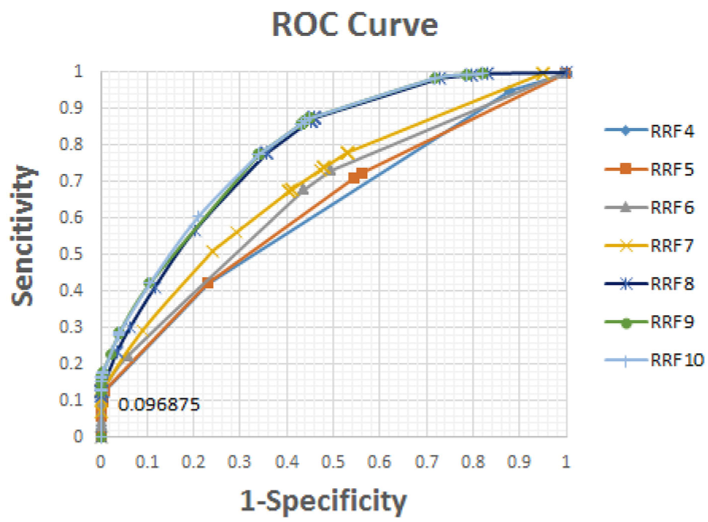 Figure 2: ROC curves of different RRF configurations, highlighting the superiority of the RRF8 selection.
Real-World Impact: The Early Warning System
The most compelling evidence came from 7-year follow-up data (2008–2015). BCRAM successfully flagged 91.4% of future patients as high-risk years before their diagnosis. From a public health economics perspective, this is a game-changer: by focusing screening only on the high-risk group, health authorities can save over 60% of screening costs without missing the majority of cases.
Critical Insight & Conclusion
The Takeaway: BCRAM proves that context is king. By moving away from "black-box" genetic models and toward "transparent" epidemiological networks, we can create localized, low-cost diagnostic tools that outperform global standards.
Limitations:
- Computational Complexity: Storing large similarity matrices for millions of people requires significant RAM/CPU.
- Questionnaire Reliability: The model relies on self-reported data, which can introduce bias.
Future Work: The transition to a "Medical Social Network" opens the door for Graph Neural Networks (GNNs) to further automate risk feature extraction, potentially discovering hidden correlations between lifestyle and oncology that traditional statistics would overlook.