
Behind the Scenes of Educational Data Mining: Why Your LMS Data is Probably Lying to You
Behind the scenes of educational data mining
This paper defines a rigorous four-stage pre-processing framework (Gathering, Interpretation, Creation, Organization) for Educational Data Mining (EDM). Grounded in multi-year data from chemistry courses at two academic institutions, it demonstrates how raw Learning Management System (LMS) logs can lead to inaccuracies without systematic cleaning of non-student activities and redundant records.
Executive Summary
TL;DR: This research shines a light on the "dirty secret" of Educational Data Mining (EDM): raw data from Learning Management Systems (LMS) like Moodle is often riddled with noise from staff activities and system artifacts. The authors propose a four-stage pre-processing framework—Data Gathering, Interpretation, Database Creation, and Organization—that reveals how failing to clean data can lead to a 32% error margin in behavior analysis.
Academic Positioning: This work serves as a methodological "call to arms," moving EDM from ad-hoc data crunching toward a standardized, transparent engineering pipeline that ensures research reproducibility and validity.
The "Invisible" Crisis in Learning Analytics
While researchers often focus on sophisticated predictive models (e.g., predicting dropouts via Neural Networks), they frequently overlook the quality of the input. Most LMS logs are designed for system administration, not scientific research. Prior work often ignores the fact that:
- Administrative Noise: Teachers, Tutors, and IT staff generate log entries that mimic student behavior but follow entirely different patterns.
- Fictitious Activities: Students may open multiple tabs or experience network glitches, creating "duplicate" logs that inflate engagement metrics.
- Interpretation Gaps: A "file open" event in a log file doesn't actually mean a student learned; it simply means a server request was fulfilled.
Methodology: The Four-Stage Pre-processing Pipeline
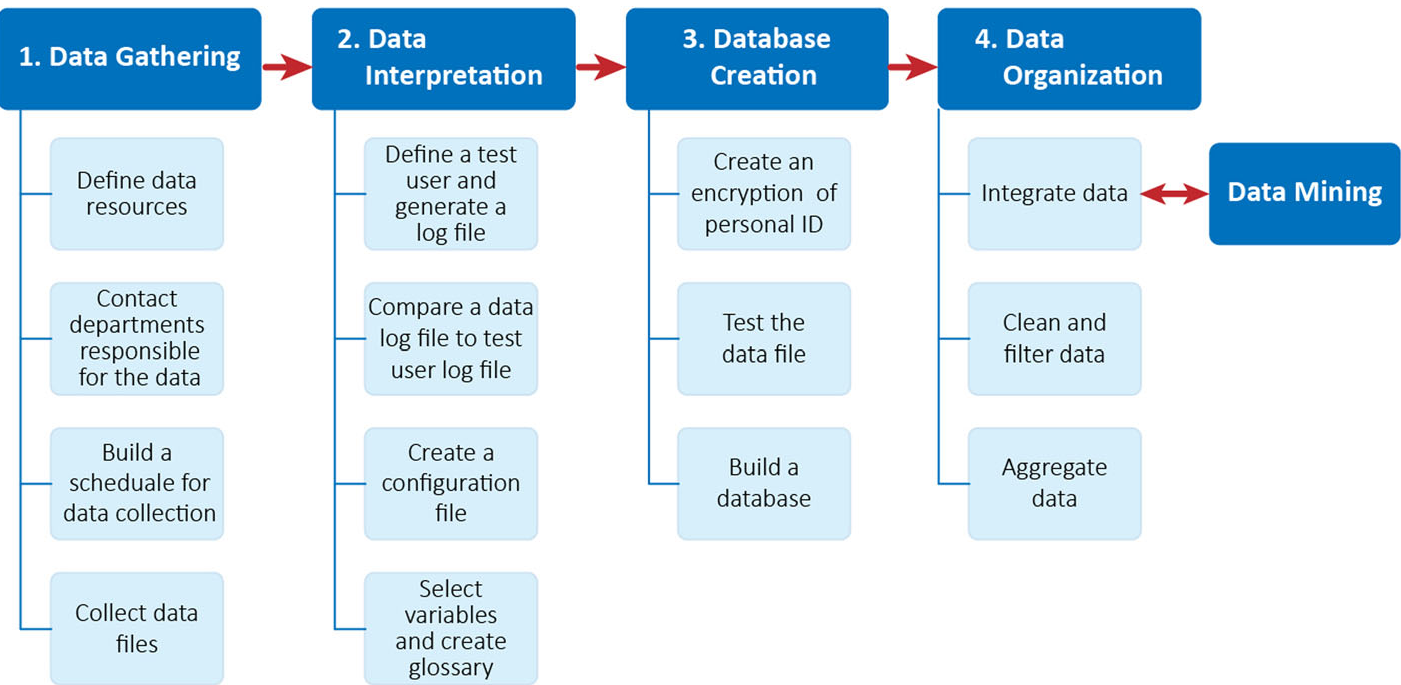
The authors argue that the pre-processing phase accounts for 60%-90% of a researcher’s time. To formalize this, they developed a workflow used across chemistry courses at the Open University of Israel and the Weizmann Institute of Science.
1. Data Gathering & Cooperation
Unlike controlled lab experiments, EDM requires navigating institutional politics. Accessing raw logs often means collaborating with IT departments who govern security (GDPR compliance) and system updates that might change data formats mid-semester.
2. The Interpretation Layer
The most critical contribution is the Activity Configuration File. Researchers logged in as "guest users" to perform specific actions and then matched those actions to the cryptic strings generated in Moodle logs. This "Ground Truth" mapping prevents researchers from misidentifying a system background task as a student learning event.
3. Reliability Glossary: Handling the Noise
The authors identified several "traps" in LMS variables:
- User Type: In one study, 22% of records were actually from non-students.
- Timestamps: Overlapping activities make "time-on-task" calculations highly unreliable without a defined "timeout" parameter (e.g., ignoring clicks within 1 minute).
- IP Addresses: Inaccurate for location tracking due to VPNs and LAN proxies.
Experimental Evidence: The Cost of Dirty Data
The study compared "Total Activity Counts" against "Unique User Activities" to demonstrate how different metrics tell vastly different stories.
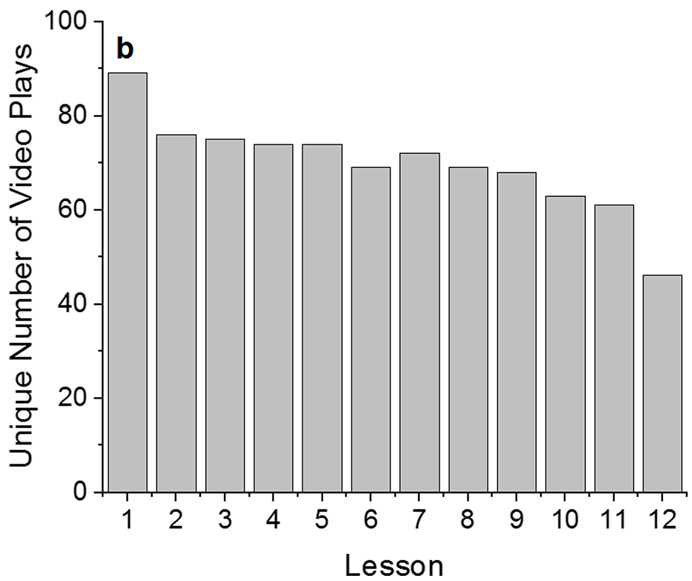
As shown in the charts above:
- Chart (a): Total plays suggested a sharp 61% dropout rate in video engagement.
- Chart (b): Unique user plays (the more accurate metric for student persistence) showed a much more stable trend with only a 48% decline.
By filtering out non-student records and redundant clicks, the authors showed that the perceived "Authenticity" of the findings increased significantly. Without these filters, an educator might wrongly conclude that a specific lesson was a "failure" simply because it triggered the most technical errors or required more administrative staff clicks.
Critical Insight & Conclusion
The paper concludes that "Interpretation is the key." Data science is not just about the algorithm; it is about the domain-specific nuances of the data source.
Takeaways for the Industry:
- Institutional Policy: Universities should automate the generation of "research-ready" reports, rather than handing over raw, messy log files to researchers.
- Standardization: Every EDM paper should be required to include a "Pre-processing Appendix" detailing how they handled non-student data and overlapping timestamps.
- Limitations: The study is based on Moodle; while the workflow is generalizable, the specific configuration strings will vary for Canvas, Blackboard, or custom-built LMS platforms.
Ultimately, this work pulls back the curtain on the "messy" middle of data science, proving that the most advanced AI model is only as good as the cleaning strategy that preceded it.