
Precision Marketing in Insurance: Decoding the Pyramid with Big Data Mining
Precision Marketing Strategy of Insurance Market from the Perspective of Big Data
This paper presents a precision marketing framework for the insurance industry using Big Data analytics. It leverages the K-means clustering algorithm to segment customers into five distinct profiles, enabling tailored insurance product recommendations and strategy optimization.
TL;DR
In an increasingly competitive financial landscape, mass marketing is dead. This paper demonstrates a robust framework using the K-means clustering algorithm to segment the insurance market into five distinct archetypes. By analyzing variables such as annual income, deposit amounts, and transaction frequency, the study provides a roadmap for "precision marketing"—ensuring the right insurance product hits the right customer at the right lifecycle stage.
Background & Positioning
The Chinese insurance market has expanded rapidly over four decades, yet it faces a "marketing bottleneck." Traditional methods are too blunt to handle the nuances of modern consumer behavior. This work positions itself as a practical bridge between raw Big Data mining and Strategic Management, shifting the focus from "what we sell" to "who they are."
The Core Motivation: Moving Beyond Demographics
Why do standard marketing campaigns fail? Because two 30-year-olds with the same degree might have vastly different financial "gravity." One might be a "car loan/house loan" elite, while another is a "rich second generation" with high liquidity. The authors argue that precision marketing must be rooted in unsupervised learning to uncover these hidden associations that human intuition might miss.
Methodology: The K-Means Engine
The research utilized a dataset of 5,997 samples from a Shenzhen insurance branch.
1. Feature Engineering
The authors identified eight critical dimensions to define a customer:
- Demographics: Gender, Age, Education, Marriage.
- Financials: Annual Earnings, Deposits, Annual Turnover, and Management Amount.
2. Finding the "Sweet Spot" (K=5)
To avoid arbitrary segmentation, the team used an iterative approach. By monitoring the Sum of Squared Errors (SSE) and pseudo-F statistics, they determined that 5 clusters provided the most stable and representative segmentation.
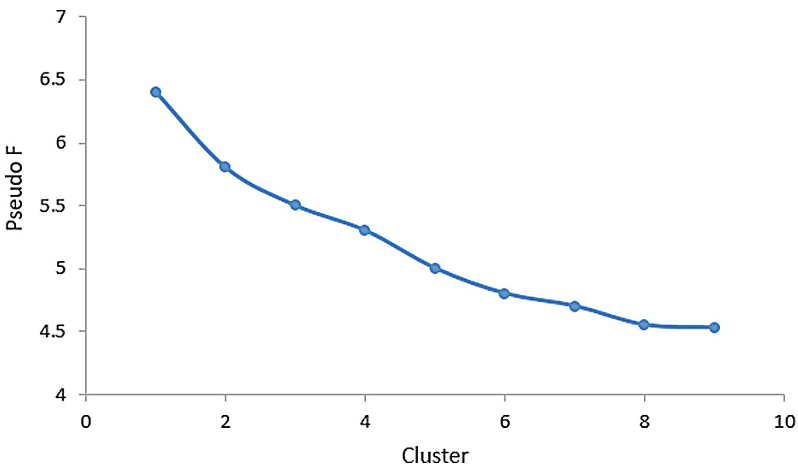 Fig 1: Mathematical determination of the optimal cluster count (K=5).
Experimental Analysis: The Inverted Pyramid
The results revealed a fascinating social structure within the insurance company's database, aligning with a "pyramid" distribution:
- Tier 1 (The Base): Young, unmarried degree holders with low income but high consumption. Suggestion: Critical illness/Medical insurance (high leverage, low premium).
- Tier 2 (Stable Middle): Married professionals ("Car/House loan" group). Suggestion: Auto and Accident insurance.
- Tier 3 (High Potential): The "Rich Second Gen"—low personal income but massive deposits/turnover. Suggestion: Financial insurance/Property insurance.
- Tier 4 (SME Owners): High turnover, low financial management awareness. Suggestion: Enterprise investment & Compensation insurance.
- Tier 5 (VIP/Diamond): The top of the pyramid with 5M+ deposits. Suggestion: Private wealth management & High-end medical insurance.
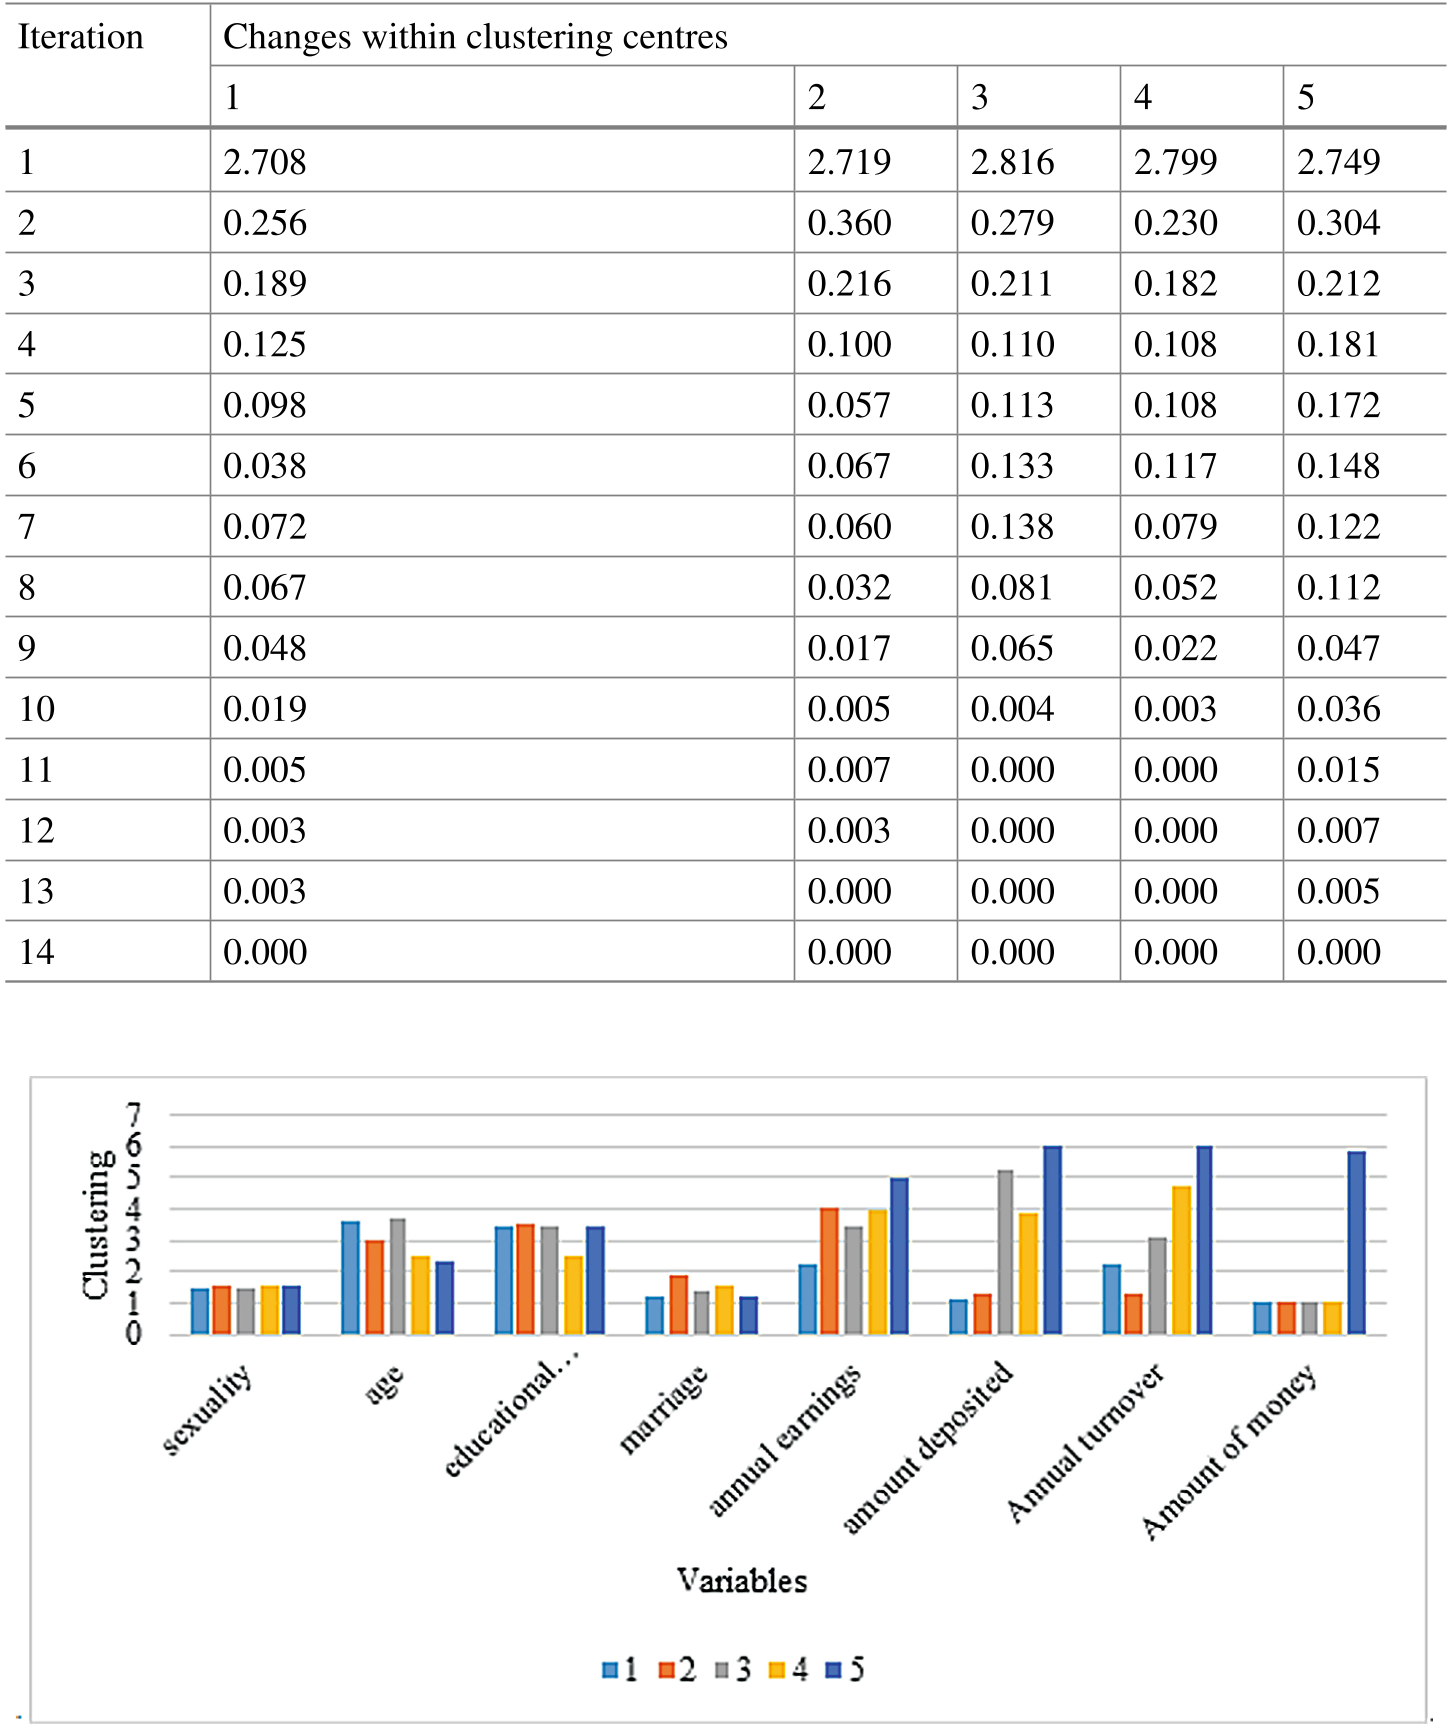 Fig 2: Heatmap showing the divergence of attributes across the five clusters.
Critical Insights & Takeaways
Why this works: The K-means algorithm effectively identifies the "Inductive Bias" in the data—the fact that financial behavior is more predictive of insurance needs than age or gender alone.
The Strategic Shift:
- For the Base: Focus on Brand Recognition and low-cost entry products.
- For the Peak: Focus on One-to-One Private Service and high-stickiness loyalty programs.
Challenges and Future Work
While the K-means approach is efficient, it is a "snapshot" in time. The authors acknowledge that as "fragmented media" continues to evolve, future models should incorporate Temporal Analysis (how a Tier 1 customer evolves into Tier 2) and perhaps Association Rule Mining (Apriori) to discover specific product pairings (e.g., "People who buy Auto insurance are 60% more likely to buy Personal Accident insurance within 3 months").
Conclusion
This paper serves as a vital blueprint for insurance companies looking to digitize their sales funnel. By moving from intuition-based sales to data-driven precision, firms can significantly improve conversion rates and customer lifetime value (CLV).