
C5.0 and Cost-Sensitive Learning: Redefining Breast Cancer Risk Prediction for Postmenopausal Women
Breast cancer risk prediction model based on C5.0 algorithm for postmenopausal women
2018-12-01
Summary
Problem
Method
Results
Takeaways
Abstract
This paper presents a breast cancer risk prediction model specifically tailored for postmenopausal women using the C5.0 decision tree algorithm. By integrating clinical data from 1,031 participants and optimizing the model with a cost matrix to address class imbalance, the authors achieve a balanced sensitivity and specificity of over 85%.
## TL;DR
Breast cancer remains a critical threat to postmenopausal women, yet many prediction models fail due to geographical specificity or genetic testing costs. This study proposes a **C5.0-based decision tree model** that focuses on demographic and physiological data. By implementing a **Cost Matrix**, the researchers transformed a model that was "blind" to cancer cases into a diagnostic tool with **85.71% sensitivity**, outperforming traditional SVMs and Neural Networks.
## The Imbalance Paradox: Why High Accuracy Can Be Fatal
In medical data mining, we often encounter a "needle in a haystack" problem. In this study's dataset of 1,031 women, only 26 had confirmed breast cancer.
If a model simply predicts "No Cancer" for everyone, it achieves **97.7% accuracy** but **0% sensitivity**. This is exactly what happened with the standard Neural Network and SVM baselines. In a clinical setting, a 97% accurate model that never finds a sick person is worse than useless—it’s dangerous. The authors recognized that the "cost" of a False Negative (missing a patient) is infinitely higher than a False Positive (extra screening).
## Methodology: The Power of C5.0 and Cost Management
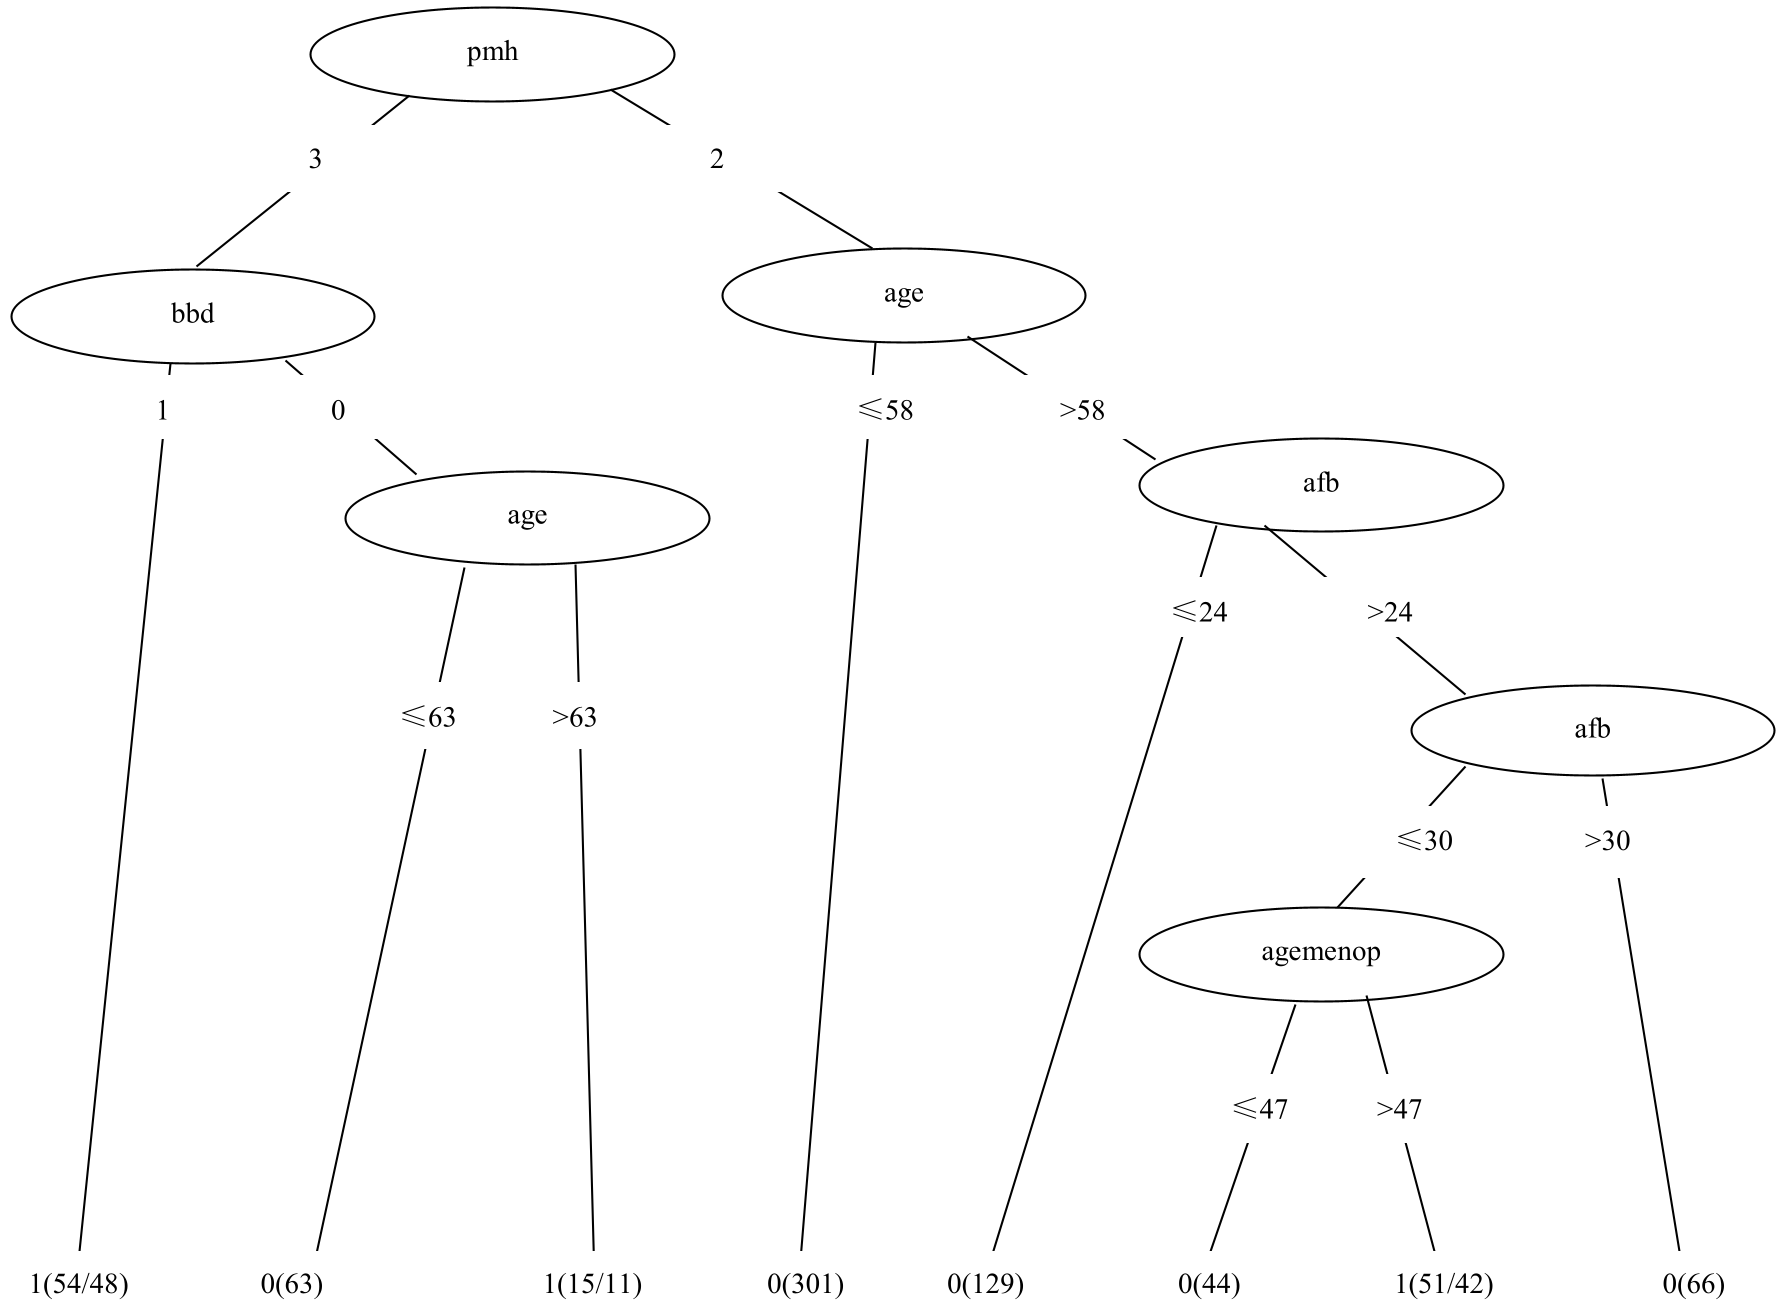
The **C5.0 algorithm** was selected for its efficiency in handling diverse data types and its ability to generate human-readable rules. Unlike "black-box" models, C5.0 produces a decision tree that clinicians can interpret.
### 1. Model Architecture
The team leveraged the Information Gain Ratio as the splitting criterion, ensuring the tree did not overfit to features with many unique values.
### 2. The Cost Matrix Intervention
To force the model to "care" about the 26 cancer cases, they introduced a cost matrix:
- **Cost of False Positive (Healthy predicted as Sick):** 1
- **Cost of False Negative (Sick predicted as Healthy):** 30
This 30-fold penalty shift adjusted the decision boundaries, sacrificing a bit of overall accuracy to ensure that cancer cases were captured.
## Experimental Results: Sensitivity is King
The comparison between the Default C5.0, Adaptive Boosting (AdaBoost), and the Cost Matrix version reveals a stark contrast:
| Model | Sensitivity | Specificity | Accuracy |
| :--- | :--- | :--- | :--- |
| Default C5.0 | 0.0000 | 1.0000 | 97.73% |
| SVM Model | 0.1429 | 0.9801 | 96.10% |
| **Costmatrix_C5.0** | **0.8571** | **0.8538** | **85.39%** |
While the Costmatrix model dropped in accuracy to ~85%, it successfully identified ~86% of the actual patients, whereas the Neural Network and Default C5.0 identified **none**.

## What Truly Drives Risk?
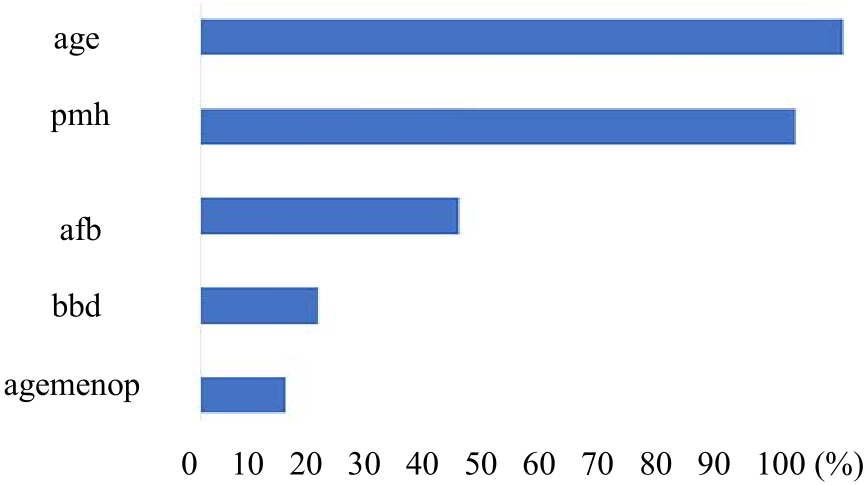
By analyzing the variable importance within the C5.0 model, the researchers identified the primary "culprits" for breast cancer risk in this demographic:
1. **Age (100% Importance)**: The undeniable baseline factor.
2. **Post-menopausal Hormone (PMH) levels (92.53%)**: The most significant physiological marker.
3. **Age of First Childbearing (40.11%)**: Reflecting long-term endocrine history.
## Critical Analysis & Future Outlook
**Insight**: The study proves that interpretability (Decision Trees) + Strategic Optimization (Cost Matrix) is superior to Raw Power (Neural Networks) in clinical small-sample scenarios.
**Limitations**: The dataset contains only 26 positive cases. While the results are statistically promising, the model needs validation on a larger, multi-center cohort to ensure the observed rules for PMH and age aren't artifacts of this specific sample.
**Future Direction**: Integrating this cost-sensitive C5.0 approach with "Ensemble of Experts" could potentially refine the specificity further without losing that vital 85%+ sensitivity.