
Monitoring the Blue Granary: Scalable Aquaculture Mapping via Machine Learning and GEE
Cage and floating-raft aquaculture (CFRA) in China's offshore waters has been rapidly expanding. Mapping the spatial distribution of such large-scale CFRA is the basis for studying and controlling impacts of aquaculture on the environment, and further optimizing CFRA spatial arrangement. Supporting by Google Earth Engine (GEE) platform, this paper took China's coastal areas as study region, and applied machine learning methods to extract CFRA from Sentinel-2 remote sensing big data. Firstly, according to the characteristics of CFRA, images with cloud-free in April, 2020 were selected and the sea area within 30 kilometers away from the coastline was determined as study area. Secondly, the random forest (RF) and support vector machine (SVM) classification algorithms were utilized to extract CFRA with sample set. Finally, on the basis of accuracy test, spatial distribution characteristics of CFRA were analyzed in ArcMap. The results show: (1) Compared with SVM, RF can obtain higher classification accuracies with 0.945 of overall accuracy and 0.904 of Kappa coefficient; (2) Large-scale CFRA are distributed in the bays of Liaoning, Shandong and Fujian Province, as well as around the islands of Zhejiang, Fujian Province; (3) Large-scale CFRA are often distributed around small islands in the south while around ports in the north; (4) The CFRA areas in Fujian and Shandong rank first and second, occupying 29% and 23%, respectively, of the total CFRA area
This study presents a large-scale remote sensing mapping of Cage and Floating-Raft Aquaculture (CFRA) across China’s offshore waters using Sentinel-2 data on the Google Earth Engine (GEE) platform. By implementing a Random Forest (RF) classifier, the researchers achieved a state-of-the-art overall accuracy of 0.945 in identifying complex marine aquaculture structures.
Executive Summary
TL;DR: This paper introduces a robust framework for mapping offshore Cage and Floating-Raft Aquaculture (CFRA) along the Chinese coastline. By utilizing the Google Earth Engine (GEE) and Random Forest (RF) algorithms on Sentinel-2 big data, the authors successfully mapped over 2,100 km² of aquaculture with an impressive 94.5% accuracy.
Context: Within the domain of maritime remote sensing, this work represents a significant transition from local, pixel-based classification to regional, cloud-based machine learning analytics, addressing the logistical challenges of monitoring "Blue Carbon" and marine food security.
The Challenge: Why Marine Mapping is Hard
Mapping offshore structures like cages and rafts is notoriously difficult for three main reasons:
- Atmospheric Interference: Coastal areas are prone to persistent cloud cover and complex convection, making single-scene captures unreliable.
- Spectral Confusion: The spectral signature of seawater varies significantly based on depth, suspended sediment, and chlorophyll levels, often "masking" the presence of aquaculture rafts.
- Scale: China's coastline is vast. Processing thousands of high-resolution images locally is computationally prohibitive.
Methodology: The GEE + Machine Learning Pipeline
The authors developed a systematic workflow to turn raw satellite bytes into actionable spatial intelligence.
1. Data Processing and Feature Engineering
Instead of relying on raw RGB bands, the team engineered a 9-dimensional feature set. Key indices included:
- NDWI (Normalized Difference Water Index): To segment sea from land.
- NDVI & BSI: To differentiate the organic and synthetic materials of rafts and cages from the surrounding water.
- Spectral Selection: Features like B12 (Short-wave Infrared) and B8A (Narrow NIR) were identified as critical for distinguishing subtle aquaculture textures.
2. Model Selection: RF vs. SVM
The study conducted a head-to-head comparison between Random Forest (RF) and Support Vector Machine (SVM). Random Forest emerged as the winner because its ensemble nature (using multiple decision trees) is better at handling the non-linear boundaries found in complex marine spectral data.
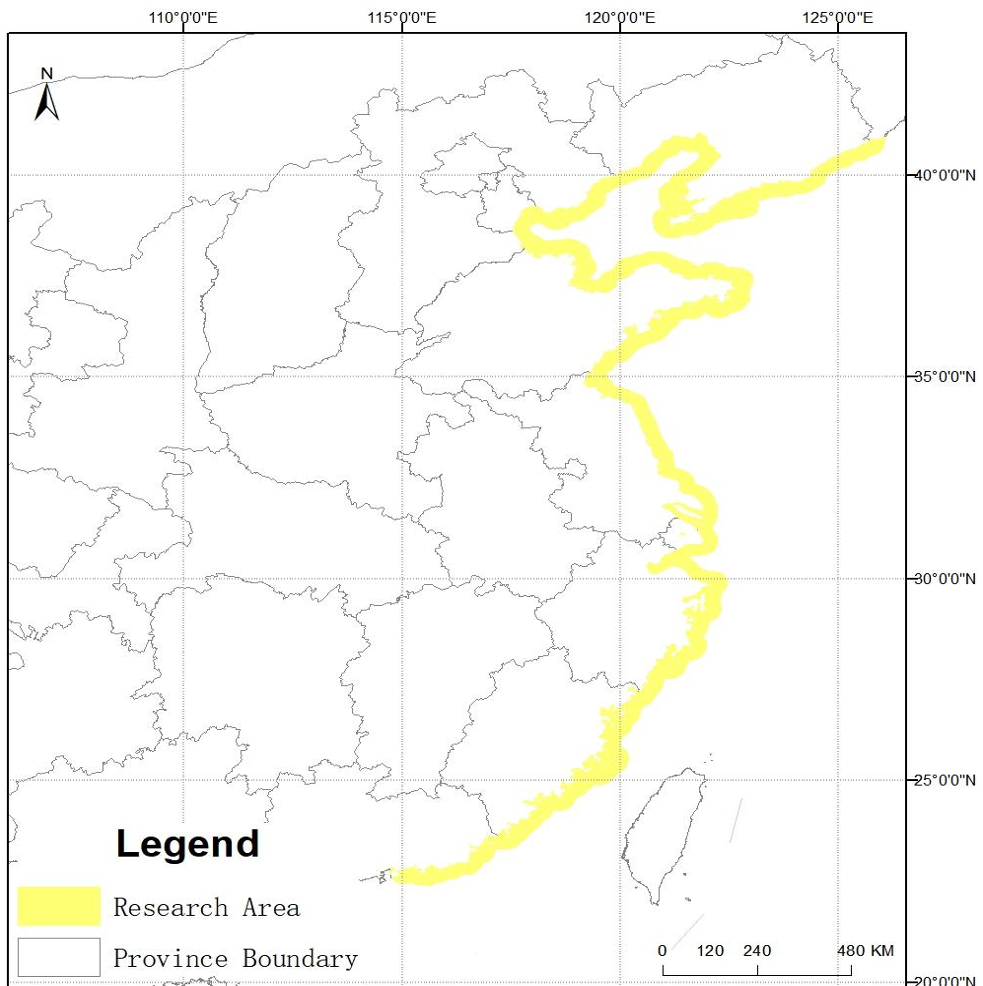 Figure 1: The proposed workflow from data acquisition in GEE to final spatial analysis.
3. Post-Processing with Superpixels
To fix the "salt-and-pepper" noise (randomly misclassified pixels) common in pixel-based methods, the authors used SLIC (Simple Linear Iterative Clustering). This groups neighboring pixels into "superpixels," ensuring that the final output aligns with the physical shapes of real-world aquaculture farms.
Experimental Results & Geospatial Insights
The model achieved high precision, particularly in the Fujian and Shandong provinces, which were identified as the epicenters of CFRA in China.
- Overall Accuracy: 0.95
- Kappa Coefficient: 0.90
- Total Identified Area: ~2,130 km²
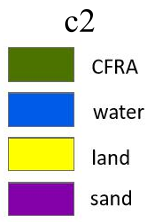 Figure 2: Spatial distribution of aquaculture across the six coastal provinces studied.
Geographical Discoveries
The study revealed a fascinating North-South divide in aquaculture geography:
- South (e.g., Fujian, Zhejiang): Farms are clustered around islands, seeking shelter from the open sea.
- North (e.g., Liaoning, Shandong): Farms are primarily located near ports and large bays, benefiting from the sheltered coastal geometry.
Critical Analysis & Future Outlook
Takeaway: The integration of GEE and RF provides a scalable, cost-effective solution for maritime governance. This data is vital for ensuring that aquaculture expansion doesn't lead to the eutrophication of coastal waters.
Limitations:
- Timing: The study only used data from April. Since aquaculture is seasonal (harvesting and recycling of rafts), a year-round analysis is needed for a comprehensive view.
- Sensors: While Sentinel-2 (optical) is excellent, combining it with Sentinel-1 (SAR) would allow for monitoring through clouds and during nighttime.
Future Work: The next evolution of this research lies in Deep Learning (CNNs/Transformers). While RF is powerful, deep learning can better capture the distinctive "grid-like" geometric patterns of cages that spectral indices might miss.