
Digital Breath: Modeling the Carbon Cost of Your Social Media Habit
Modelling carbon footprint on smartphone usage for social networking
This research develops a quantitative model to estimate the carbon footprint of smartphone usage, specifically focusing on social networking. Utilizing data from 400 college students, the study identifies a significant correlation (Predictive Value 0.534) between usage patterns—categorized into entertainment, communication, and business—and annual carbon emissions.
TL;DR
Is your Instagram habit heating the planet? This study provides a mathematical bridge between smartphone usage patterns and environmental degradation. By surveying 400 users, researchers developed a specialized carbon footprint model showing that our addiction to entertainment and chat apps—often exceeding 10 hours a day—is a measurable driver of global CO2 emissions due to constant battery recharging cycles.
Problem & Motivation: The Hidden Cost of "Always On"
Most environmental discussions regarding tech focus on e-waste (discarded hardware). However, the "invisible" emission—the electricity consumed by billions of devices needing daily charges—is a growing crisis.
The authors argue that smartphone usage has become so pathological (80% of users spend more time with phones than family) that it creates a feedback loop: High Usage -> High Battery Drain -> Frequent Recharging (2-3 times/day) -> Increased Carbon Footprint. Existing "Green IT" research lacked a granular model that could translate how we use apps into how much CO2 we emit.
Methodology: From App Taps to CO2 Tons
The core of this research is the Smartphone Carbon Footprint Model. The researchers didn't just look at total time; they categorized usage into:
- Entertainment: Video (YouTube), Games.
- Communication: Social Networks (Facebook, LINE, Instagram).
- Work/Business: Productivity tools.
The Mathematical Intuition
The researchers utilized a standard formula adapted for mobile behavior:
Carbon Footprint (CO2e) = Activity Data (Time) × Emission Factor × 365 Days
Using an emission factor of 0.5821 (sourced from the TGO), they established a predictive relationship between behavior and environmental impact.
Experimental Insights: 10 Hours of Tapping
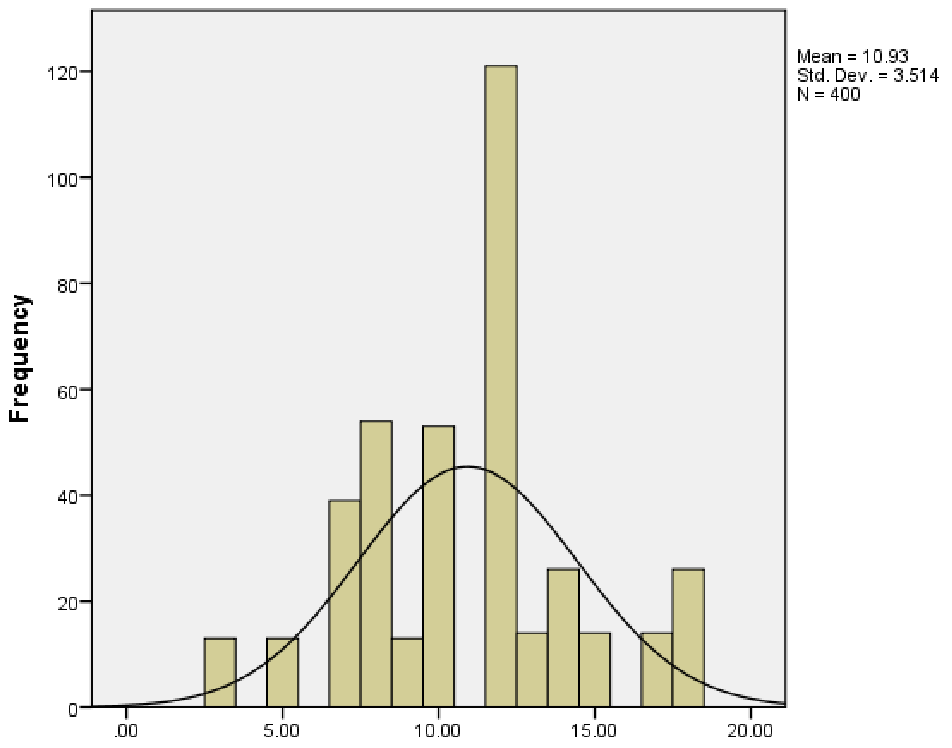
The data collection from 400 students yielded startling behavioral insights:
- Recharge Frequency: Over 40% of users recharge their phones twice a day, and nearly 40% more recharge three times.
- Usage Duration: The majority of users exceed 10 hours of active usage per day.
- Peak Activity: Usage peaks significantly between 3 PM and 5 PM, coinciding with social networking "prime time."
SOTA Comparison & Correlation
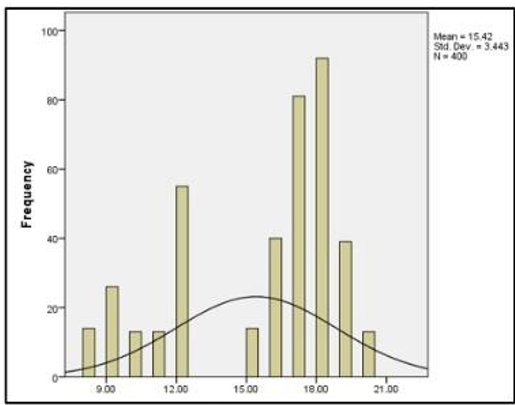
The study applied linear regression to validate the model. The results showed a standardized coefficient (Beta) of 0.732, proving that the "Pattern Usage Factor" is a highly reliable predictor of a user's total carbon behavior.
Critical Analysis & Future Outlook
The Takeaway
The paper successfully shifts the focus from "what device you own" to "how you use it." By quantifying the relationship (), the researchers provide a foundation for future "Eco-Apps" that could alert users when their digital consumption exceeds sustainable limits.
Limitations
The primary limitation is the reliance on self-reported data via questionnaires. Humans often underestimate their screen time. Additionally, the model uses a static emission factor; in reality, the carbon cost of electricity varies depending on whether the power grid is currently using renewable energy or coal.
Future Work
The authors suggest integrating this model directly into smartphone operating systems. Imagine a "System Settings" toggle that doesn't just show "Battery Health," but "Total CO2 Emitted this Month"—a powerful tool for driving digital sustainability.
Editor's Note: This research is a crucial step in aligning the Information Systems (IS) field with global Climate Action goals.