
MobiVis & OntoVis: Deciphering the Invisible Threads of Social Networks
Cell phone mini challenge award: Intuitive social network graphs visual analytics of cell phone data using mobivis and ontovis
This paper presents MobiVis and OntoVis, a collaborative visual analytics framework designed to analyze complex cell phone data and social networks. By integrating structural and semantic filtering with interactive time charts, the system won awards for its intuitive discovery of behavioral patterns in the VAST 2008 Mini Challenge.
TL;DR
Analyzing cell phone records is more than just looking at a list of calls; it is about understanding the shifting topology of human relationships. This paper introduces a visual analytics suite that uses semantic abstraction (ontology-driven filtering) and structural abstraction to transform "hairball" network graphs into actionable insights, specifically tackling the VAST 2008 challenge.
Background: The Clutter of Connection
In the era of big data, cell phone records represent a classic "Heterogeneous Graph" problem. We have people, calls, cell towers, and timestamps all intertwined. If you plot every call as a line, the resulting visualization is a useless mess of overlapping strokes. The challenge isn't just showing the data, but filtering it without losing the "Aha!" moment.
Motivation: Moving Beyond Brute Force
The authors identified that most analysts struggle because they can't see the forest for the trees. To find a "person of interest," you need to filter by semantics (what kind of entity is this?) and topology (who are they connected to?). Their intuition was that by providing a high-level "Ontology Graph," users could define association rules—like "Show me everyone who used these specific towers to call this specific person"—thereby stripping away 90% of the noise.
Methodology: The Core Engine
The framework relies on two primary pillars:
1. The Ontology Context (OntoVis)
Instead of just showing nodes, the system uses a meta-graph (the Ontology Graph). This allows for Semantic Abstraction. Users can select entity types (e.g., "Cell Tower" or "Call Duration") to create custom views. For example, linking people nodes to the green "Tower" nodes reveals the geographical footprint of a social group.
2. Temporal and Structural Abstraction
Structural abstraction utilizes node degrees of separation to create focus-plus-context views. Complementing this is the Interactive Timechart, which plots activity over a 24-hour or multi-day period.
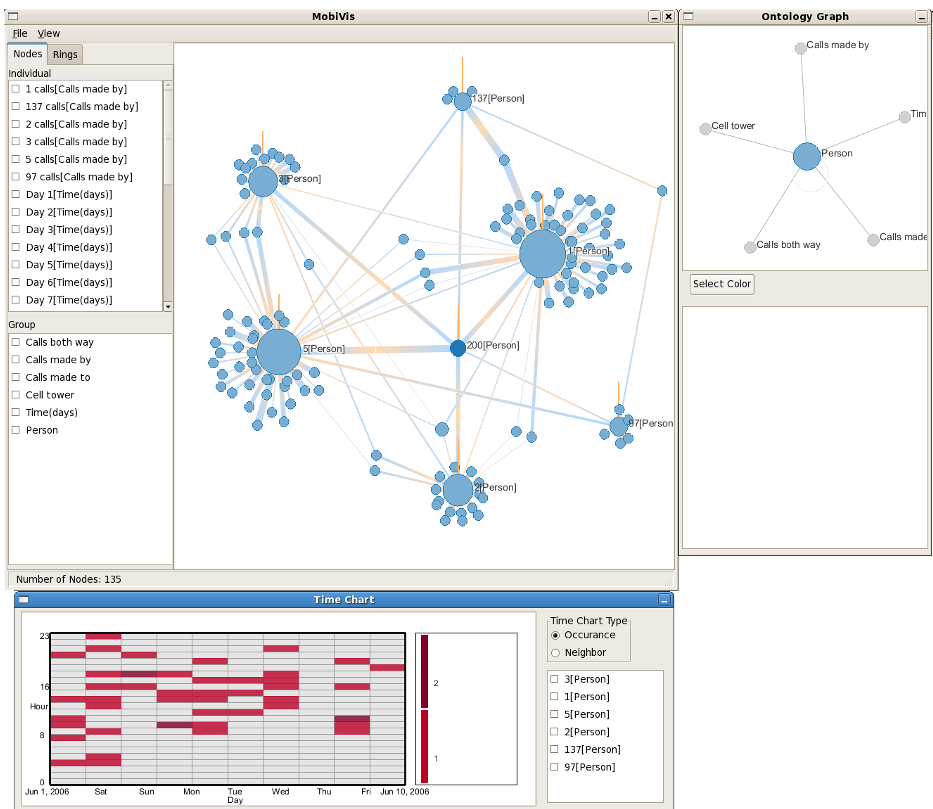 Figure 1: The main interface showing the force-directed social graph (center), the ontology graph (top right), and the temporal activity chart (bottom).
Experiments: Cracking the VAST Challenge
Using the VAST 2008 dataset, the team demonstrated the power of Cyclic Discovery. They didn't just follow a straight line; they moved from overview to detail and back again.
- The Day 8 Event: By using the call graph (Figure 3), the team noticed an almost uniform pattern of communication that suddenly ceased after Day 7.
- Geographic Sparsity: By applying semantic rules, they visualized how two different cell phones (IDs 200 and 300) interacted with cell towers. Despite having many users, the visualization revealed a distinct geographic sparsity, suggesting these phones were being used for very specific, localized tasks.
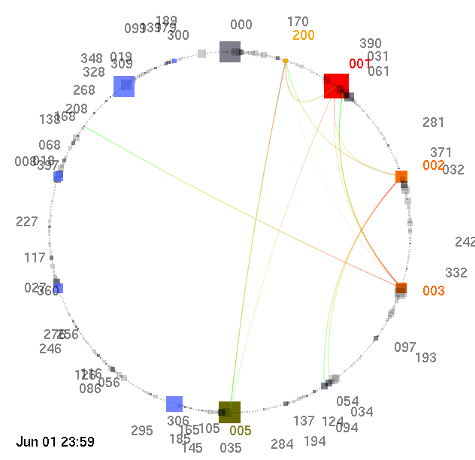 Figure 2: Semantic abstraction revealing the relationship between specific phone users and the cell towers they accessed, providing a proxy for geographic movement.
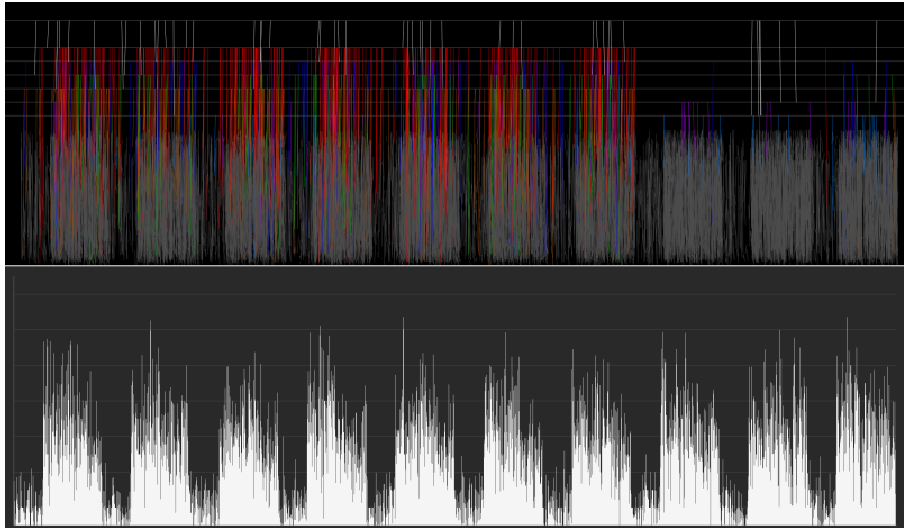 Figure 3: Linear call graph showing communication patterns over time. Notice the high density followed by a sudden drop-off, a classic indicator of a behavioral shift.
Critical Insight & Conclusion
The true value of MobiVis isn't just in the layout algorithm, but in its Inductive Bias toward human-centered discovery. It recognizes that in investigative analytics, the user needs to pivot between different dimensions (time, geography, and social links) seamlessly.
Takeaway: Effective visualization of complex networks requires "Semantic Abstraction"—treating the graph not just as a collection of points, but as a structured hierarchy of entities and rules.
Limitations: While powerful, the system still relies heavily on the user's ability to define correct "association rules." Future iterations would benefit from automated anomaly detection to suggest where the analyst should look first.