
Decoding Secret Social Hierarchies: A Temporal Analysis of Mobile Call Graphs
Cell phone mini challenge award: Social network accuracy— exploring temporal communication in mobile call graphs
This paper presents a visual analytics approach for the VAST 2008 Mini Challenge, utilizing the "TemporalNet" tool to map the Catalano/Vidro social network. By combining force-directed layouts, PageRank-based importance scoring, and Jaccard similarity for structural equivalence, the authors successfully identified key actors and a major hierarchical shift in the network.
TL;DR
This research tackles the VAST 2008 Mini Challenge by uncovering the hidden hierarchy of the Catalano/Vidro social network. By utilizing a custom tool called TemporalNet, the authors identified a massive structural shift on June 8th, where a new set of "equivalent actors" took over the communication roles of previous members, signaling a change in the organization's operational leadership.
Positioning in the Field
Published as an award-winning entry for the VAST 2008 contest, this work is a classic example of Visual Analytics applied to intelligence gathering. It bridges the gap between static graph theory and dynamic temporal analysis, moving beyond simply "who calls whom" to "why did the network swap its key players?"
Problem & Motivation: The Static Graph Trap
In many social network analyses, researchers look at a single aggregate snapshot of data. However, criminal or covert organizations often rotate their members or change communication protocols to evade detection. The authors realized that looking at the 10-day dataset as a whole would blur these transitions. The core intuition was that Structural Equivalence—the idea that two people are "equal" if they talk to the same group of people—could reveal when one operative had been replaced by another.
Methodology: Bridging Intuition and Math
1. The Temporal Pivot
The team discovered that between June 7th and June 8th, the "neighborhood" of the primary target (ID 200) essentially vanished, replaced by a new cluster.
2. Measuring Similarity with Jaccard Coefficients
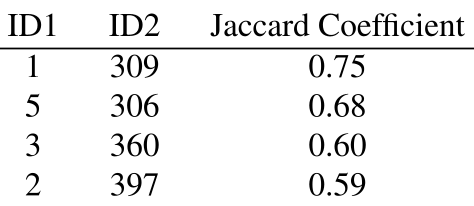
To prove that the new group was a mirror of the old one, they used the Jaccard Coefficient, a statistical measure of similarity between sets.
If two nodes have a high Jaccard coefficient, they serve the same functional role in the network. As shown in the table below, pairs like (1, 309) showed extremely high similarity (0.75), indicating ID 309 was the "successor" or "parallel" to ID 1.
3. Visualizing the Shift
The authors used a force-directed layout to visualize the "Before" and "After." The importance of each node was scaled using PageRank, highlighting the natural leaders (central nodes) versus the foot soldiers (peripheral nodes).
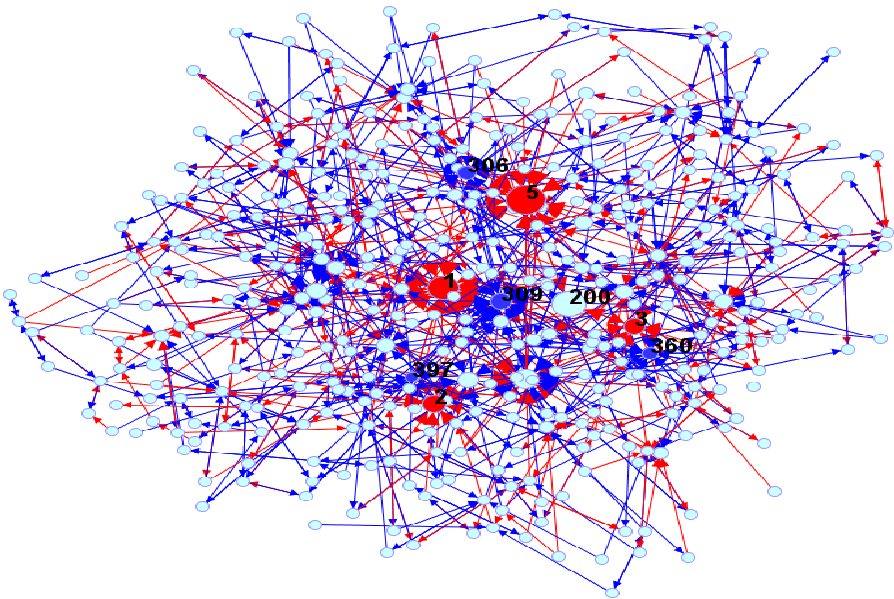 Figure 1: Comparison of call graphs on June 7th (red) vs June 8th (blue), showing the displacement of the original network.
Experimental Analysis & Results
Mapping the "New Order"
The analysis identified ID 200 (Ferdinando Catalano) as the initial focal point. However, by the end of the 10-day period, a new leader, ID 300, emerged. By constructing egocentric networks (networks centered around a single person), the authors visualized how the organization evolved.
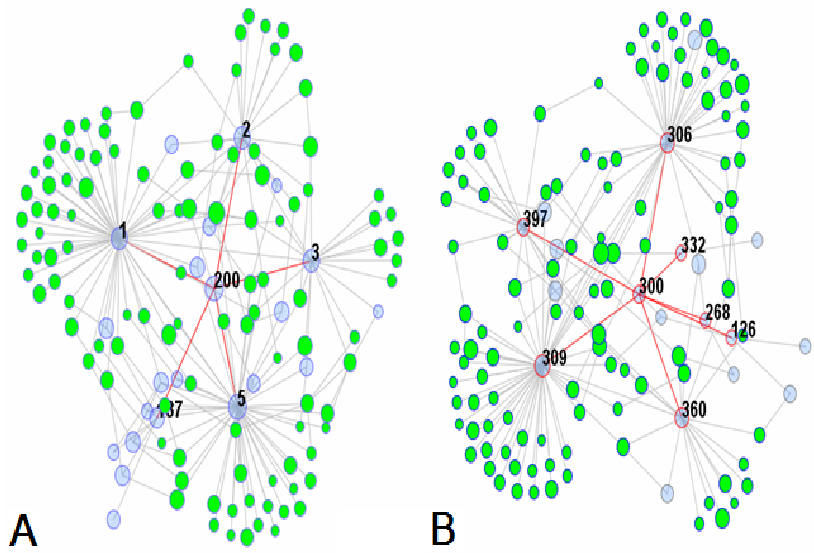 Figure 2: (A) Social network during the first 7 days centered around ID 200; (B) The shift to ID 300 in the final 3 days.
The Three-Layer Hierarchy
The final contribution was the reconstruction of the organization's command structure:
- Level 1 (The Controllers): IDs 0, 200, and 300.
- Level 2 (The Lieutenants): Equivalent actors (red and dark blue nodes) who manage the flow of information.
- Level 3 (The Field): The broader set of occasional contacts.
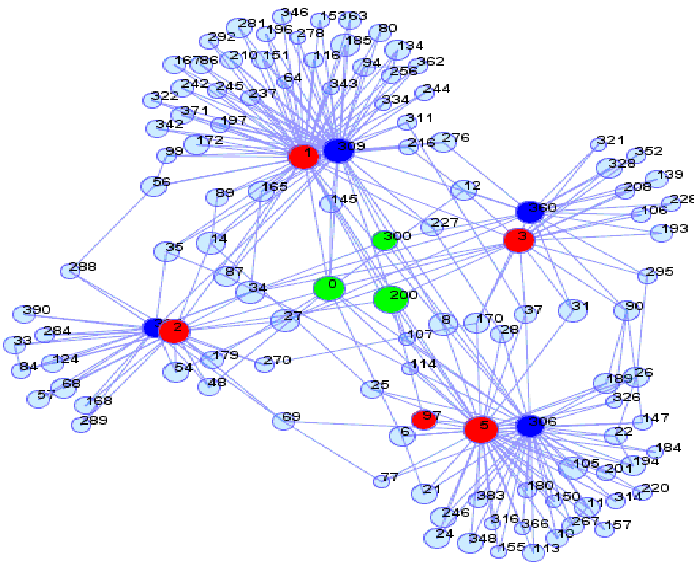 Figure 3: The final synthesized hierarchy of the Catalano/Vidro network.
Critical Insight & Conclusion
The genius of this paper lies in its use of structural equivalence to track temporal evolution. It demonstrates that in any communication-heavy data, the "role" someone plays is often more important than their specific ID.
Takeaway for Practitioners: When analyzing dynamic networks, don't just look for new nodes; look for new nodes that occupy the old nodes' "mathematical space."
Limitations: The approach relies heavily on the Jaccard coefficient, which might struggle with extremely sparse data or individuals who deliberately vary their communication partners to avoid "similarity" detection.