
Digital Fingerprints of Polarization: Decoding User Behavior in the 2016 US Election
Characterizing Politically Engaged Users' Behavior During the 2016 US Presidential Campaign
This paper presents a comprehensive characterization of four distinct user groups (Hillary advocates, Trump advocates, political bots, and regular users) on Twitter during the 2016 US Presidential Campaign. Utilizing a massive dataset of 23 million tweets, the study employs K-means clustering and Subjective Well-Being (SWB) metrics to analyze language patterns, popularity dynamics, and affective shifts.
TL;DR
By analyzing 23 million tweets from the 2016 US election, researchers have successfully mapped the "archipelago" of political Twitter. Using K-means clustering and Subjective Well-Being (SWB) analysis, the study identifies four key species of users—Hillary Advocates, Trump Advocates, Robots, and Regular Users—uncovering how candidate tweets act as emotional triggers across these groups.
The Problem: Beyond the "Average" User
In political science and data mining, we often ask "What is the sentiment of Twitter?" but this is a flawed question. Twitter is not a single voice; it is a collection of distinct personas with vastly different levels of commitment. Previous research struggled to differentiate between the Advocate (the digital soldier who will never change their mind) and the Regular User (the bystander who might). This paper fills that gap by providing a rigorous taxonomy of political engagement.
Methodology: The Architecture of Digital Archetypes
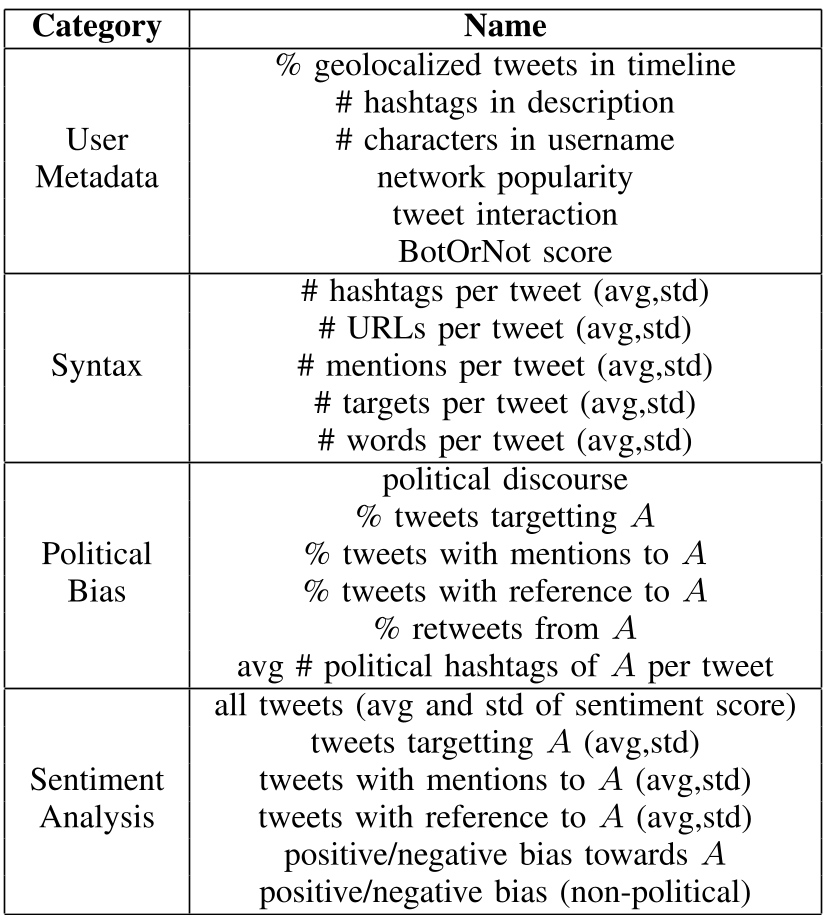
The researchers didn't just look at what people said, but how they behaved. They used a 44-feature set across four categories: Metadata (popularity), Syntax (hashtag usage), Political Bias (mention ratios), and Sentiment Analysis (positivity/negativity toward specific targets).
The Clustering Logic
The authors employed a hierarchical K-means approach. First, they separated "Highly Engaged" users from "Regular" users. Then, they dove deeper into the engaged cluster to separate Trump's camp from Hillary's camp.
Core Insights: Who Drives the Conversation?
The results revealed a fascinating dichotomy in how the two campaigns lived on Twitter:
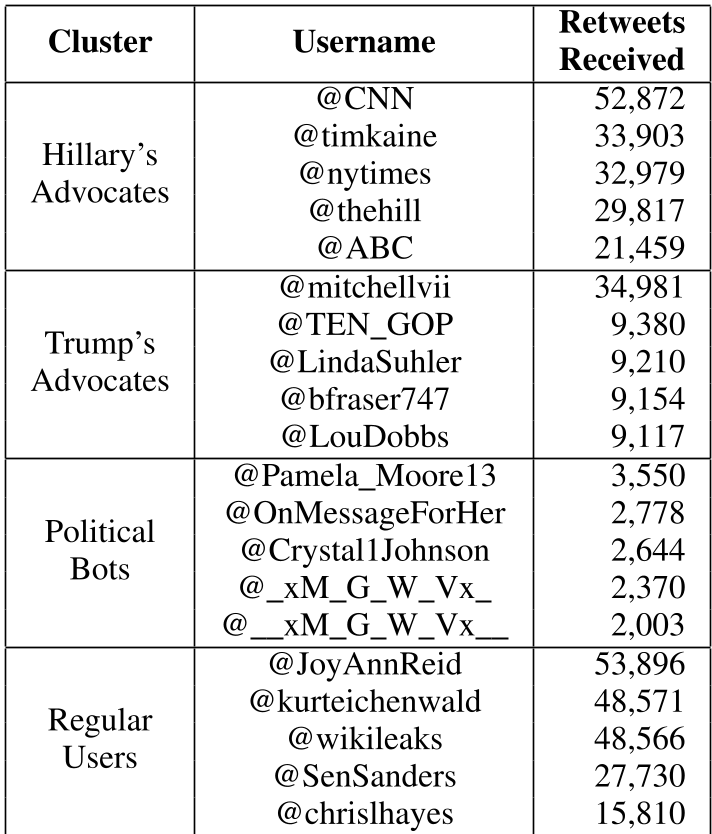
- Hillary’s Advocates were largely "Institutional." The top-retweeted accounts in this group were mainstream media outlets like @CNN and @nytimes.
- Trump’s Advocates were "Personal." His most popular supporters were individual users and unofficial influencers, signaling a more grassroots-style digital insurgency.
- Political Bots were short-lived but intense. Most were created just before the election and were eventually banned by Twitter, focusing heavily on Trump-related hashtags.
The Affective Shift: The "Sarcasm" Paradox
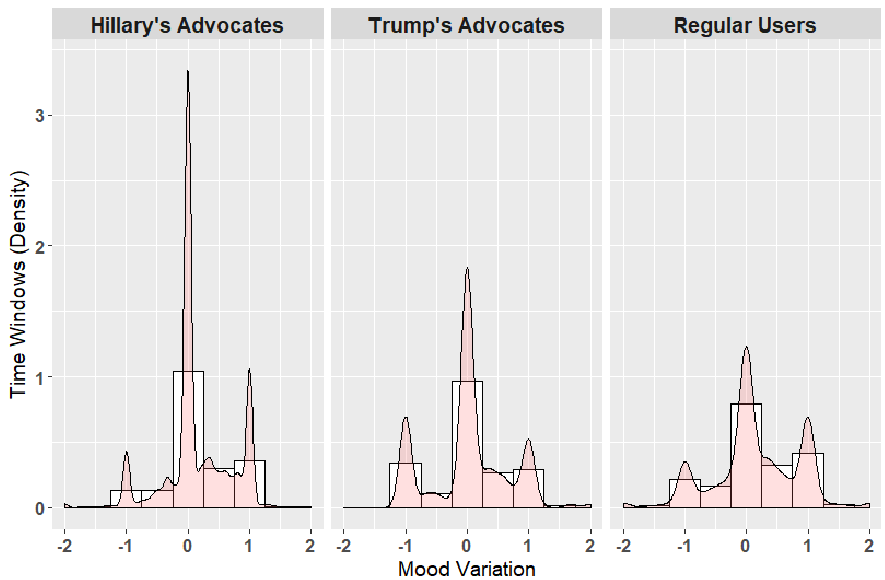
Perhaps the most intriguing part of the study is the Mood Variation Analysis. Using Subjective Well-Being (SWB), the authors measured the mood of a user 2 hours before and after they retweeted a candidate.
The formula used was:
Interestingly, when retweeting Donald Trump, both Hillary advocates and regular users showed a spike in positive sentiment. Does this mean they liked him? Highly unlikely. The researchers suggest this is a "Sarcasm Effect"—users retweeting a candidate to mock them, using language that traditional sentiment tools like SentiStrength might classify as positive despite a derogatory subtext.
Critical Analysis & Future Outlook
This paper provides a robust framework for identifying "Advocates," which is critical for understanding Inductive Bias in social datasets. However, there is a clear limitation: the reliance on lexical sentiment analysis (SentiStrength). As noted in the results, the tool's inability to detect irony/sarcasm in political "hate-tweeting" creates a skewed view of mood variation.
Future Work must integrate Large Language Models (LLMs) to better grasp the pragmatics of political speech. Nevertheless, this study remains a foundational look at how different user archetypes don't just consume news—they emotionally respond to it in predictable, group-specific patterns.
Conclusion
Whether you are a bot, a regular user, or a staunch advocate, your digital behavior during an election follows a specific "signature." Understanding these signatures is the first step in mapping the health—or pathology—of our digital democracy.