
Unlocking Educational Insights: A Data Mining Approach to Student Performance
Classification, Clustering and Association Rule Mining in Educational Datasets Using Data Mining Tools: A Case Study
This paper explores Educational Data Mining (EDM) by applying classification, clustering, and association rule mining to a real-world dataset of 666 medical entrance examinees in Assam, India. Using tools like Weka, Orange, and R Studio, the authors identify key predictors of academic performance and compare the efficacy of various machine learning algorithms.
TL;DR
This research tackles the "data tomb" problem in education by applying advanced data mining to medical entrance exam results. By comparing multiple algorithms across different software environments, the authors prove that Neural Networks can predict student success with over 90% accuracy, offering educators a powerful tool for early intervention and pedagogical planning.
Academic Positioning: This work serves as an empirical case study in Educational Data Mining (EDM), validating the use of sophisticated supervised learning over traditional statistical methods for predicting academic outcomes.
Problem & Motivation: Beyond the "Data Tomb"
Every year, educational boards collect mountains of student data—grades, demographics, and behavioral metrics. However, most of this information is archived without being analyzed for "hidden knowledge." The authors identify several gaps:
- Invisibility of Risk: Without predictive modeling, "academically poor" students are only identified after they fail.
- Attribute Complexity: Relationships between variables like "Medium of Instruction" and "Parental Occupation" are too complex for manual observation.
- The SOTA Gap: While standard tools like Weka are common, few studies provide a comprehensive comparison across classification, clustering, and association rules on real entrance exam data.
Methodology: The Core Framework
The researchers didn't rely on a single algorithm. Instead, they built an experimental pipeline across Weka, Orange, and R:
1. Feature Selection (Finding the Signal)
Using InfoGainAttributeEval, the study ranked variables by their entropy reduction. Surprisingly, Caste and Class XII Percentage were the highest-ranking predictors of performance.
2. Supervised Learning (Classification)
The team tested three distinct inductive biases:
- Decision Trees (J48): Logic-based, easy to interpret.
- Naïve Bayes: Probability-based, assuming feature independence.
- Neural Network (MLP): A multi-layer architecture using sigmoid activation functions to map complex non-linear inputs.
3. Unsupervised Learning (Clustering)
To find natural groupings without labels, they used K-means, Hierarchical Clustering, and PAM. They utilized Multidimensional Scaling (MDS) and Self-Organizing Maps (SOM) for high-dimensional visualization.
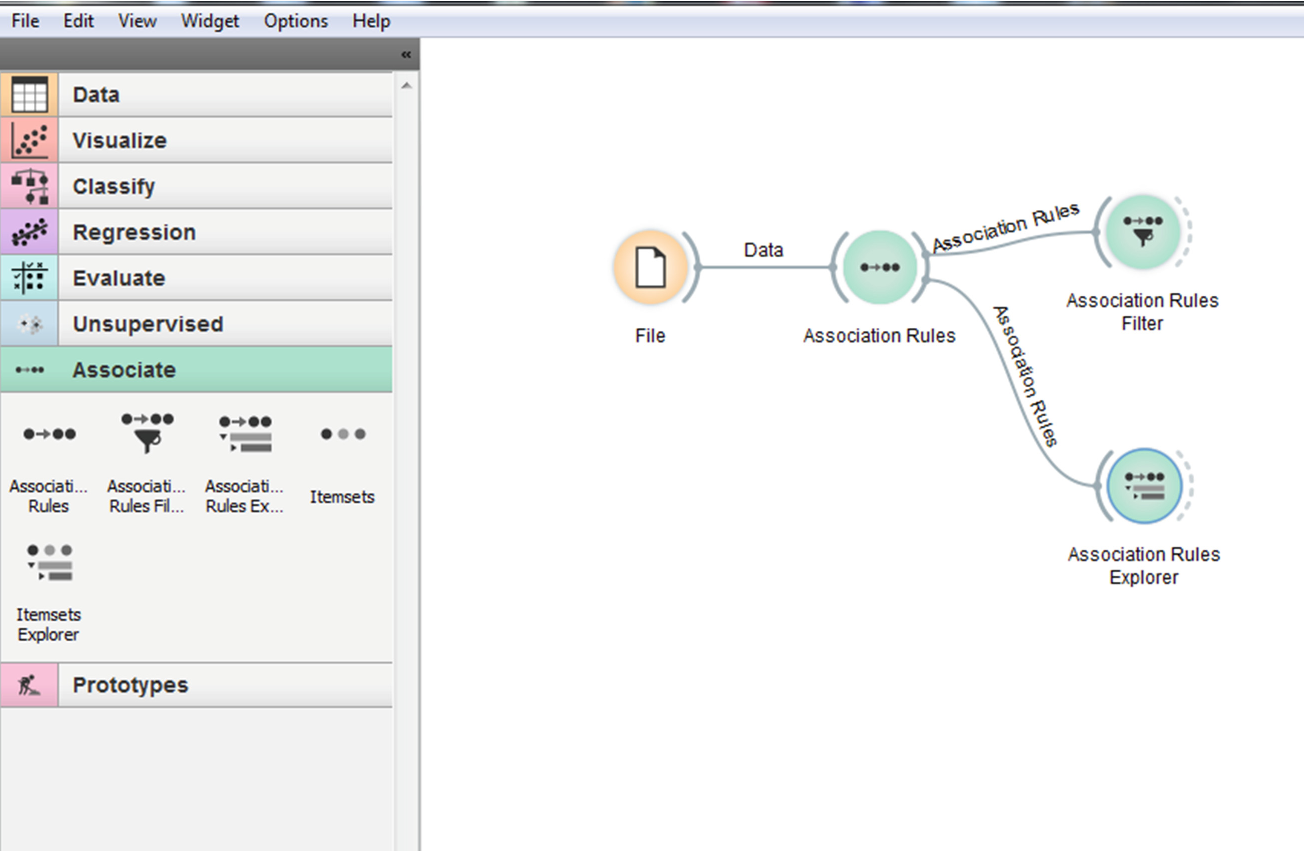 Figure 1: The Orange workflow illustrates the integration of association rules and visualization widgets.
Experiments & Results: Neural Networks Take the Lead
The experimental results challenged the common assumption that Neural Networks require "Big Data" to be effective in social sciences.
Classification Performance
| Classifier | Accuracy | MAE | RMSE |
|---|---|---|---|
| Neural Network (MLP) | 90.84% | 0.0658 | 0.1861 |
| Decision Tree (J48) | 64.71% | 0.2296 | 0.3388 |
| Naïve Bayes | 57.81% | 0.2567 | 0.3625 |
The Multilayer Perceptron (MLP) was the clear winner, achieving the lowest Error rates (MAE and RMSE). This suggests that the relationship between socio-economic factors and entrance exam rank is highly non-linear.
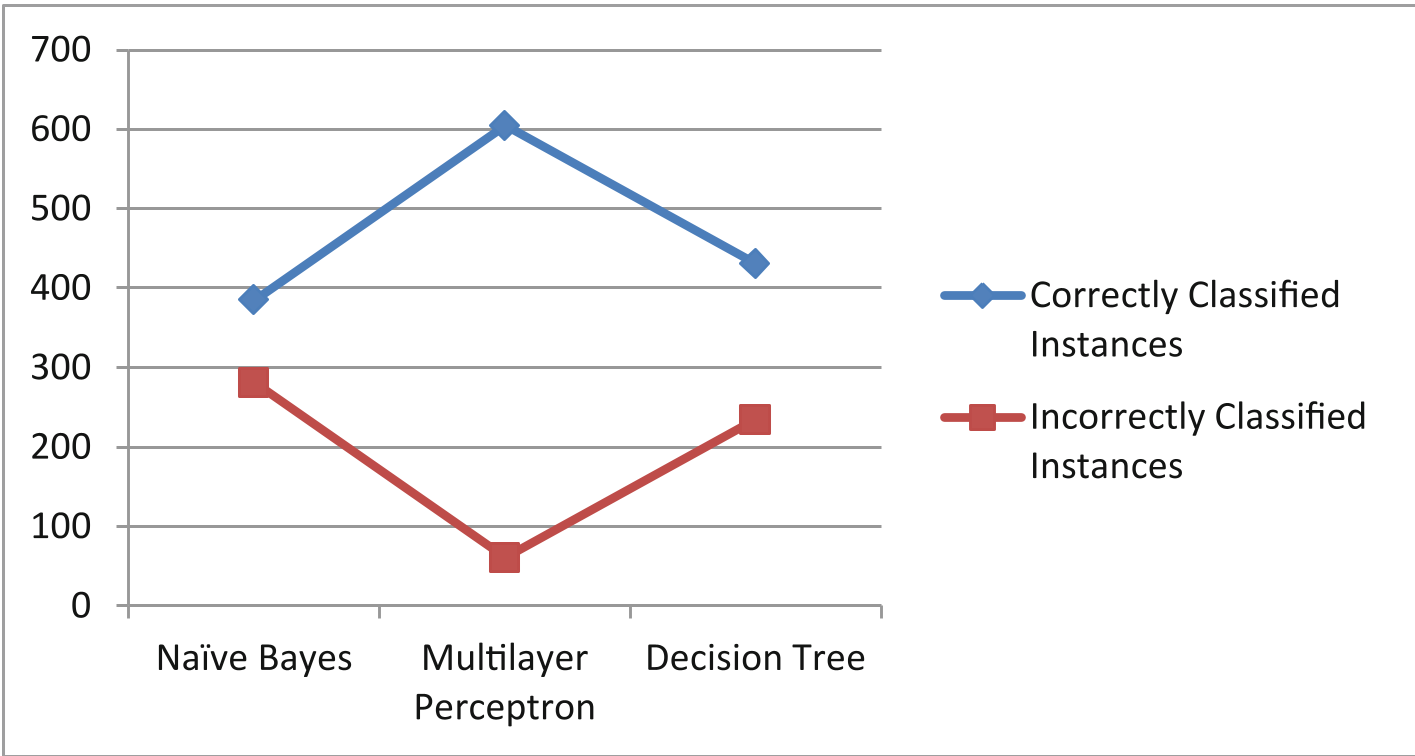 Figure 2: Accuracy comparison between the three classifiers highlights the dominance of MLP.
Clustering & Association Insights
- Rule Discovery: A strong association rule was found between
Class_XII_Percentage=ExcellentandClass_X_Percentage=Excellent(95.5% confidence), confirming a high degree of performance consistency over time. - The K=3 Optimal: Clustering analysis via Silhouette scores (0.54) indicated that three clusters optimally represent the student body when categorized by performance and background.
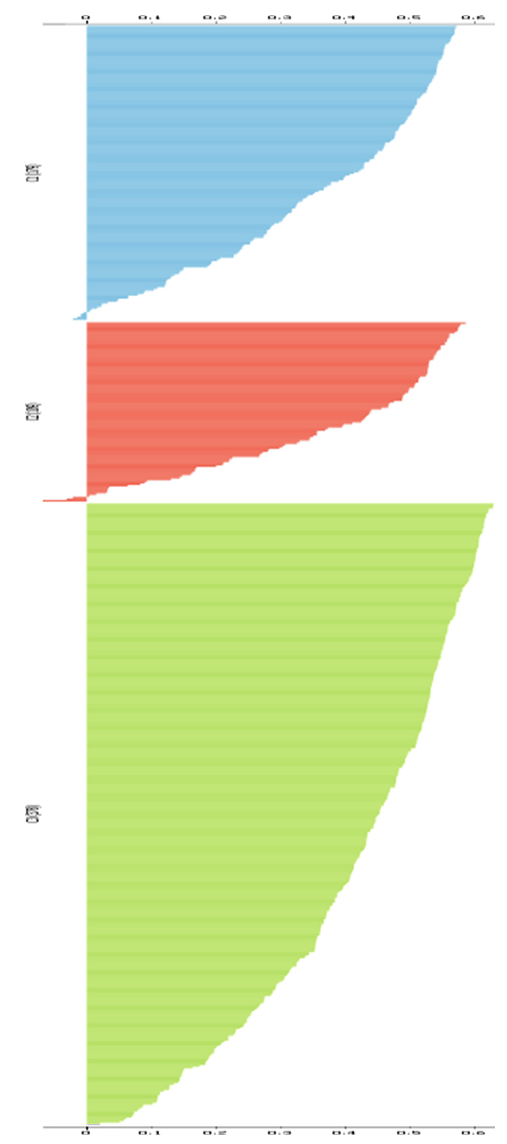 Figure 3: Silhouette plot indicating the validity of the K-means clustering (k=3).
Critical Analysis & Conclusion
Takeaway
The study proves that machine learning can effectively transform static entrance exam data into a dynamic prediction tool. The high accuracy of the Neural Network model suggests that modern AI can handle the "noise" and "ambiguity" inherent in educational datasets better than traditional probabilistic models like Naïve Bayes.
Limitations & Future Work
- Temporal Dynamics: The study uses data from a single year (2013). Future research should incorporate Time Series analysis to see how trends evolve across different academic cycles.
- Ablation of Factors: While the "Caste" attribute showed high informational gain, the ethical implications of using such demographic markers for "prediction" in a real-world setting require careful consideration and bias mitigation.
Final Thought: By moving from "data tombs" to "data insights," educational institutions can shift from reactive failure management to proactive success cultivation.