
CLUE: Unmasking Hidden Performance Bottlenecks Through Kernel Event Sketches
CLUE: System trace analytics for cloud service performance diagnosis
CLUE is a black-box system event analytics tool designed for performance diagnosis in cloud computing environments. It reconstructs complex service behaviors into "event sketches" by stitching together kernel-level event slices (system calls, IPC, network events) and utilizes unsupervised clustering and statistical analysis to localize fine-grained performance anomalies with low overhead (approx. 2% CPU).
TL;DR
Cloud service diagnosis often hits a wall when internal system behaviors—like thread synchronization or Inter-Process Communication (IPC)—become the bottleneck. CLUE is a sophisticated analytics framework that transforms raw, "black-box" kernel traces into structured "event sketches." By treating system calls like genetic sequences, it reconstructs the execution flow across threads and tiers, allowing engineers to pin-point anomalies like CPU affinity issues or mutex contention without ever touching the application source code.
The "Black-Box" Blind Spot
Performance debugging in production is a trade-off between visibility and intrusivity.
- White-box tools (like Pip or Magpie) give deep insights but require source code modifications or heavy instrumentation.
- Existing Black-box tools (like vPath or PreciseTracer) are non-intrusive but are "network-obsessed"—they only look at TCP/IP packets.
If your performance lag is caused by a thread stuck in a futex lock or a pipe communication delay, network-based tracers are blind. The authors of CLUE argue that we need to look deeper into the kernel's "implicit" signals to understand why a 16-core server might be performing like a single-core machine.
Methodology: From Raw Events to Event Sketches
CLUE's core innovation is its two-step modeling process: Slicing and Stitching.
1. Event Slicing
Instead of viewing a trace as a flat timeline, CLUE identifies Event Slices (ES):
- Explicitly Closed (EC): Bound by network markers (e.g.,
TCP_ACCEPTtoTCP_CLOSE). - Implicitly Closed (IC): Bound by internal synchronization or IPC markers (e.g.,
futex_waitandfutex_wake). This allows the tool to capture logic failures that don't involve the network.
2. Event Sketch Stitching
Inspired by DNA sequencing, CLUE "stitches" these slices together across different threads and even different physical servers. It uses metadata—like file descriptors, pointer addresses in lock structures, and precise timestamps—to prove causality between a producer thread and a consumer thread.
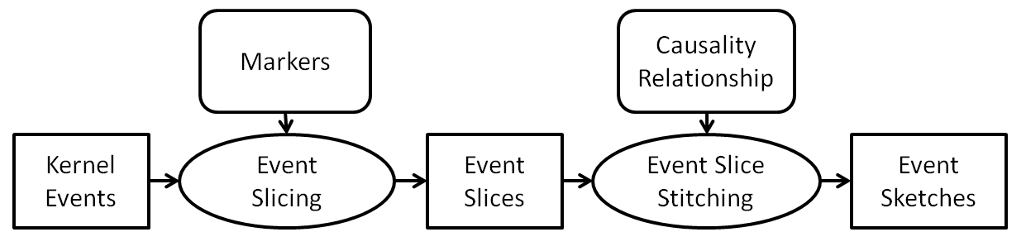 Figure 1: The CLUE Workflow—from raw kernel tracing to structural sketch modeling.
Turning Data into Insight: Conditional Data Mining
Once sketches are formed, CLUE doesn't just hand the user a raw list. It applies Conditional Data Mining. By calculating "True Latency" (subtracting the wait time of dependent tiers), it can isolate which specific tier is the culprit.
The system uses unsupervised clustering to group similar execution patterns. If 90% of your requests follow Cluster A (fast) and 10% follow Cluster B (slow), CLUE compares the kernel event frequency vectors of both to highlight the divergence in system behavior.
Case Study: The 16-Core Mystery
The paper highlights a high-stakes investigation of an Internet Gateway Transaction Application running on a 16-core HP-UX server. Despite the hardware power, throughput was abysmal.
The Diagnosis:
- CLUE extracted event sketches based on
kwakeup(synchronization) events. - Clustering revealed that active worker threads were spending massive amounts of time in an "idle" state immediately after being forked.
- By visualizing the hierarchy of event slices, engineers saw that processes were being serialized rather than running in parallel.
The Result: It was discovered that all worker processes were accidentally pinned to a single CPU core. Fixing this CPU affinity code immediately restored throughput.
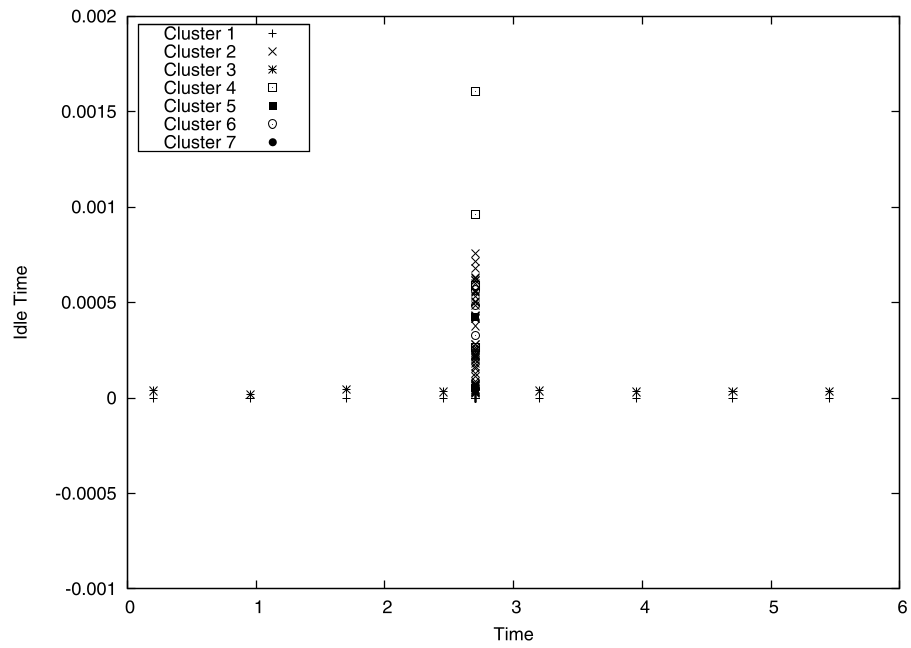 Figure 2: Clustering based on System Behavior Features, allowing for the isolation of the problematic worker thread patterns.
Critical Analysis & Conclusion
CLUE represents a significant step forward in unsupervised performance management. Its strength lies in its ability to handle "implicit" communications that traditional tracers ignore.
Takeaways:
- Efficiency: 2% overhead is the gold standard for production tracing.
- Logic over Latency: By focusing on the structure of kernel events (event sketches), CLUE finds why things are slow (e.g., scheduling interference), not just that they are slow.
Limitations: While powerful, the "stitching" of implicit slices relies on heuristics (like matching file descriptors). In highly abstracted containerized environments with complex overlay networks, these heuristics might require more sophisticated state machines to maintain accuracy.
As we move toward even more complex, ephemeral Cloud Native architectures, the "Event Sketch" approach provides a vital roadmap for automated, deep-system troubleshooting.