
Mapping the Social DNA of Software Teams: An SNA Approach to Collaboration
Bringing out collaboration in software development social networks
This paper proposes a framework to identify and classify collaboration levels within software development teams by mapping Social Network Analysis (SNA) properties (centrality and density) to the Collaboration Maturity Model (CollabMM). By mining repository interactions, it categorizes projects into coordination types, achieving a systematic way to visualize and measure group dynamics in both open-source and professional software environments.
TL;DR
Is your software project a "winner-takes-all" hierarchy or a truly collaborative ecosystem? This paper introduces a method to visualize and classify the "Collaboration Maturity" of software teams using Social Network Analysis (SNA). By mapping metrics like centrality and density to the CollabMM framework, the authors provide a lens to see the invisible coordination patterns that drive—or hinder—software development.
Background: The Invisible Interaction Problem
Software development is inherently social. Whether following Agile, Plan-driven, or Open Source models, the "work" happens in the interactions between developers. However, these interactions are usually opaque to project managers and the participants themselves. The authors argue that if we can't measure collaboration, we can't improve it.
Methodology: From Network Math to Team Dynamics
The core innovation lies in bridging the gap between graph theory and organizational psychology. The researchers mapped two primary SNA properties to the Collaboration Maturity Model (CollabMM):
- Centrality: Does one person (a "hub") control all the information flow?
- Density: How interconnected are all the members?
The Four Archetypes of Coordination
The paper defines a taxonomy for how teams organize themselves:
- Ad-hoc: Chaotic, implicit coordination with high variability.
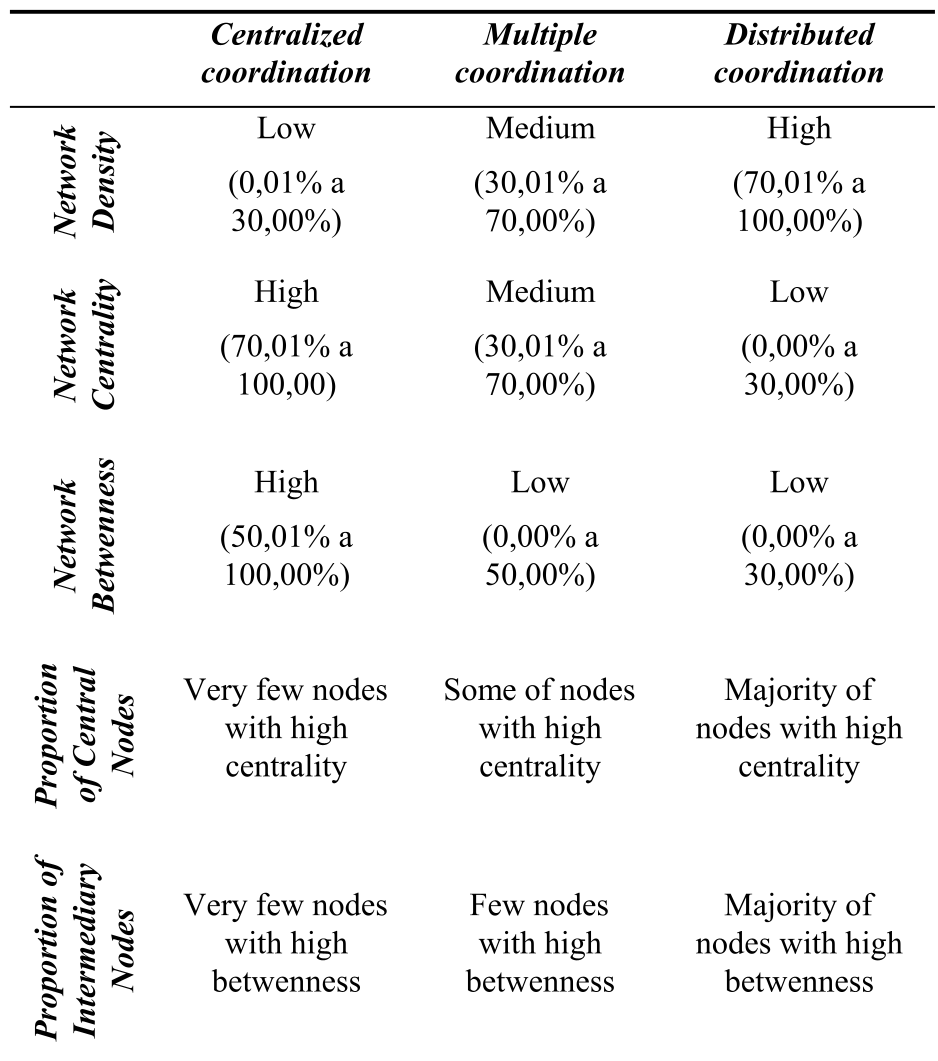
- Centralized: A "winner-takes-all" model. High network centrality (70-100%) and low density.
- Multiple: Sub-groups exist. Leaders act as bridges. Medium density (30-70%).
- Distributed: The "Golden State" of collaboration. High density (70-100%), low centrality (0-30%), where knowledge and tasks are perfectly balanced.
Deep Dive: The Hub vs. The Web
The authors propose a specific formula to calculate the Proportion of Central Nodes (), which helps identify if the "load" of management is shared or centralized:
This metric allows for a direct comparison between small nimble teams and massive "mature" opensource communities.
Experimental Insights: Does Maturity Scale?
The study analyzed 29 projects, including high-profile cases like the Irrlicht Engine and GCC.
Key Finding 1: The Size-Collaboration Trade-off The researchers found that as the number of developers increases, the probability of "Distributed Coordination" decreases. Large, "mature" communities almost always require some form of leadership hubs (Multiple or Centralized) to maintain order, even in the "flat" world of open source.
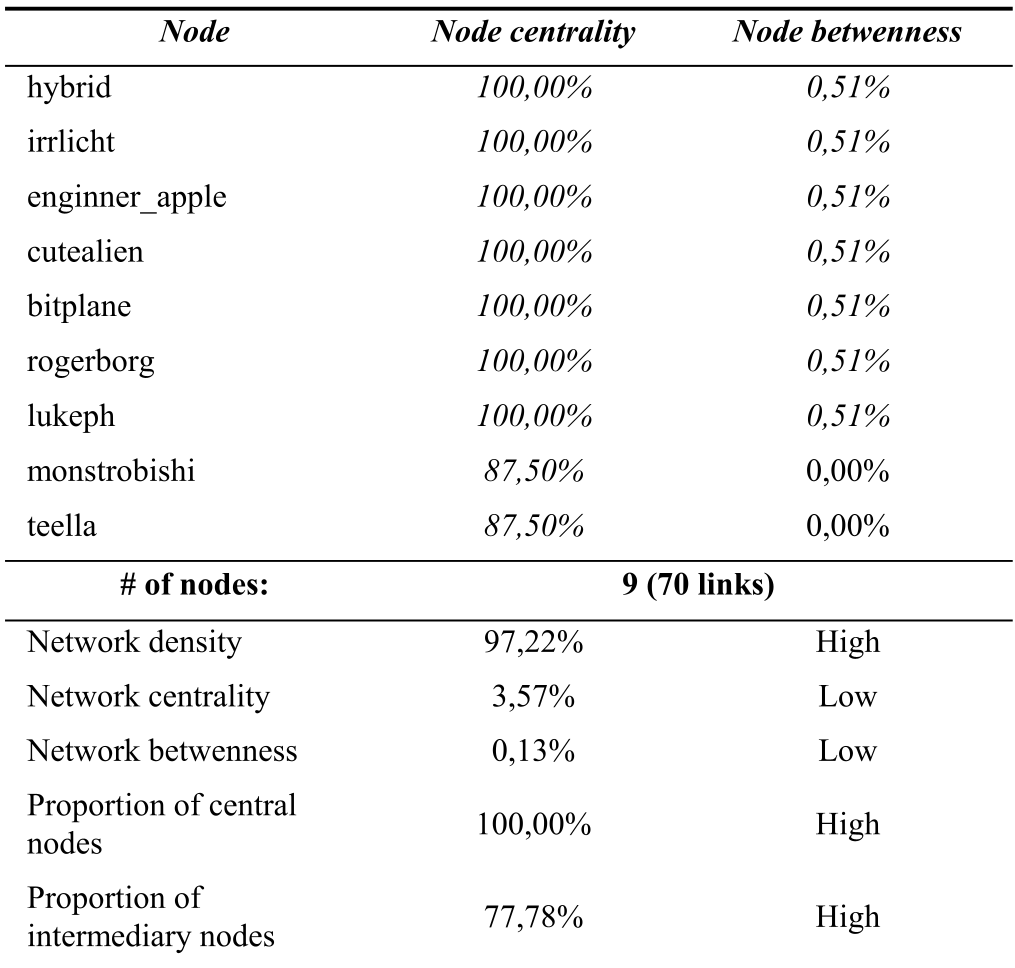
Key Finding 2: The Benchmark of Efficiency The Irrlicht Engine project emerged as a model for high collaboration. With a density of 97.22%, nearly every developer interacted with every other developer, yet the network centrality was incredibly low (3.57%), proving that high-performance teams can operate without a single point of failure (a dominant hub).
Critical Analysis: Why This Matters for the Future
The real value of this research isn't just in the classification—it's in the Awareness Mechanisms it enables.
For Managers:
By monitoring these metrics in real-time (via Git commits or mailing lists), a manager can detect when a project is becoming too centralized (creating a bottleneck) or too ad-hoc (losing direction).
For Teams:
It provides a "mirror" for the group to see their own social structure. If a team aspires to be "Agile" but their SNA shows "Centralized Coordination," they have quantitative proof of an Inductive Bias toward hierarchy.
Conclusion
This paper lays the groundwork for "Collaborative Engineering"—the idea that we can design software processes by engineering the social networks that support them. While the study was limited to commit data, future extensions into communication (Slack, Forums) promise an even more holistic view of how humans build complex systems together.
Takeaway: Software quality is a reflection of social structure. If you want better code, start by measuring your network density.