
Unmasking the Puppeteers: Using Social Network Analysis to Decode Collaborative Cyber Attacks
Discovering Collaborative Cyber Attack Patterns Using Social Network Analysis
The paper introduces a framework for identifying collaborative cyber-attack patterns by modeling malicious traffic as an Attack Social Graph (ASG). It utilizes social network analysis metrics, specifically degree centrality and hierarchical clustering, to distinguish between isolated scanners and coordinated botnet-like activities.
TL;DR
Researchers at the Rochester Institute of Technology have transitioned cyber-attack analysis from "what is happening" to "who is working together." By modeling internet traffic as an Attack Social Graph (ASG), they use degree centrality and hierarchical clustering to filter through massive datasets and pinpoint the leaders and conspirators behind coordinated digital assaults.
Background: Beyond Simple Statistics
In the landscape of 2008—and even more so today—security analysts were overwhelmed by the sheer volume of malicious traffic. Standard approaches focused on statistics: Which ports are hit most? Which IP sends the most packets? However, these questions ignore the relational structure of modern threats like Botnets and DDoS attacks. This paper argues that an attack is not just a data point; it is a social interaction between an aggressor and a victim.
The Core Insight: The Attack Social Graph (ASG)
The authors define the Attack Social Graph (ASG) as a directed bipartite graph.
- Nodes (): Attack Sources.
- Nodes (): Attacked Targets.
- Edges (): Malicious observations directed from source to target.
By analyzing this graph, the authors identify Attack Conspirators—sources that target the same victims. This relational view allows us to move past "noise" (like random background scanners) and focus on "signal" (groups of nodes acting in concert).
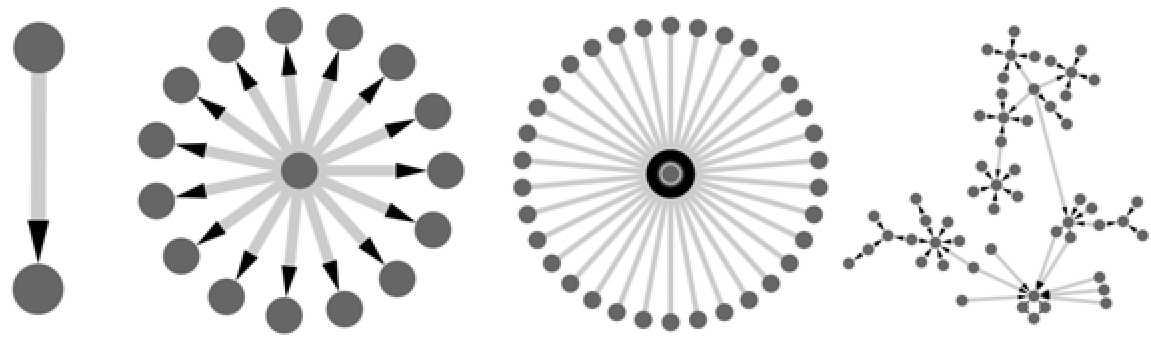 Figure 1: Different structural patterns in the ASG. The "Many-Attack-Many" case on the far right represents the most complex collaborative behavior.
Methodology: From Graph to Clusters
The researchers don't just look at the graph; they extract its DNA using Social Network Analysis (SNA) metrics:
- Feature Extraction: They derive six features based on Degree Centrality. This includes the number of targets, the average "popularity" (in-degree) of those targets, and the number of conspirators for each source.
- PCA (Principal Component Analysis): Because the features are multi-dimensional and potentially redundant, PCA is used to project these features onto a 2D plane, making clusters visually and mathematically distinguishable.
- Agglomerative Hierarchical Clustering: Instead of forcing data into a fixed number of groups (like K-means), hierarchical clustering allows for a "zoom-in" approach, finding sub-communities within larger attack groups.
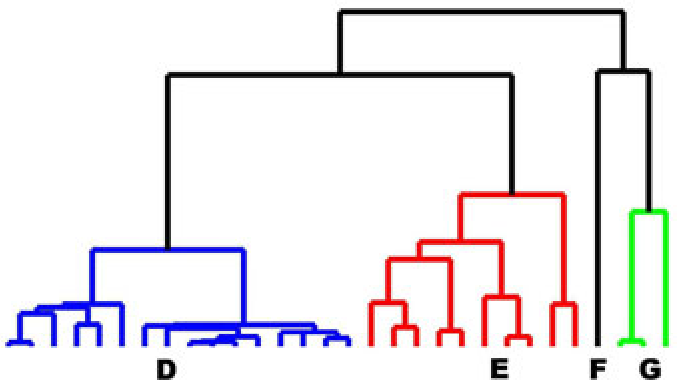 Figure 2: The recursive nature of the clustering. Feature points (a) are grouped via dendrograms (b), allowing analysts to isolate specific "Cluster C" leaders or "Cluster B" conspirator networks.
Experiments & Real-World Impact
Using the UCSD Network Telescope data, the framework processed over 122,000 edges from just a 5-minute window.
- Data Reduction: The framework effectively filtered out "One-attacks-many" noise, reducing tens of thousands of sources to just 837 critical "feature points."
- Leader Identification: The analysis successfully identified "Cluster C"—a small group of five attack sources that acted as primary navigators, attacking a massive number of targets and connecting various smaller attackers.
Critical Analysis & Conclusion
Takeaway
The brilliance of this work lies in its Inductive Bias: it assumes that malicious collaboration leaves a structural footprint. By treating attack sources like a co-authorship network, the authors successfully applied sociological tools to digital warfare.
Limitations
The primary hurdle is the Temporal Sensitivity. As shown in the paper, a longer time window (e.g., 60 minutes) leads to "random overlap," where 90% of sources appear to be collaborating simply because they hit the same popular targets by chance. Finding the "Golden Window" is essential for accuracy.
Future Outlook
While this paper uses binary edges, future iterations should incorporate Packet Weights and Temporal Evolution. In the era of AI-driven botnets, these "social" signatures will be vital for distinguishing human-led campaigns from automated swarms.