
Unmasking the Boss: Deciphering Community Evolution and Hidden Hierarchies in Social Networks
Communities and hierarchical structures in dynamic social networks: analysis and visualization
This paper introduces DySNAV (Dynamic Social Network Analysis and Visualization), a specialized system for analyzing evolving community structures and hierarchical roles in social networks. By combining dynamic graph discretization, fuzzy clustering, and communication efficiency heuristics, the system enables the detection of structural transitions and the identification of influential "masterminds" in complex data like co-authorship and terrorist networks.
TL;DR
Static snapshots of social networks hide the critical "Why" and "Who" of social evolution. This paper presents DySNAV, a system that discretizes dynamic graph data to track how communities change over time and employs a clever "Delta Efficiency" heuristic to find organizational leaders who intentionally keep a low profile.
The Dynamic Dilemma: More than Just "Moving Circles"
Most social network visualizations focus on the "hairball" problem—trying to make a static graph readable. However, real-world networks—from academic collaborations to terrorist cells—are fluid. Previous work like SoNIA or Vizster focused on individual node transitions but failed to capture when a whole community undergoes a "phase shift" or structural break. The authors argue that to understand a network, we must measure the similarity between its clusterings across time intervals.
Methodology: The DySNAV Pipeline
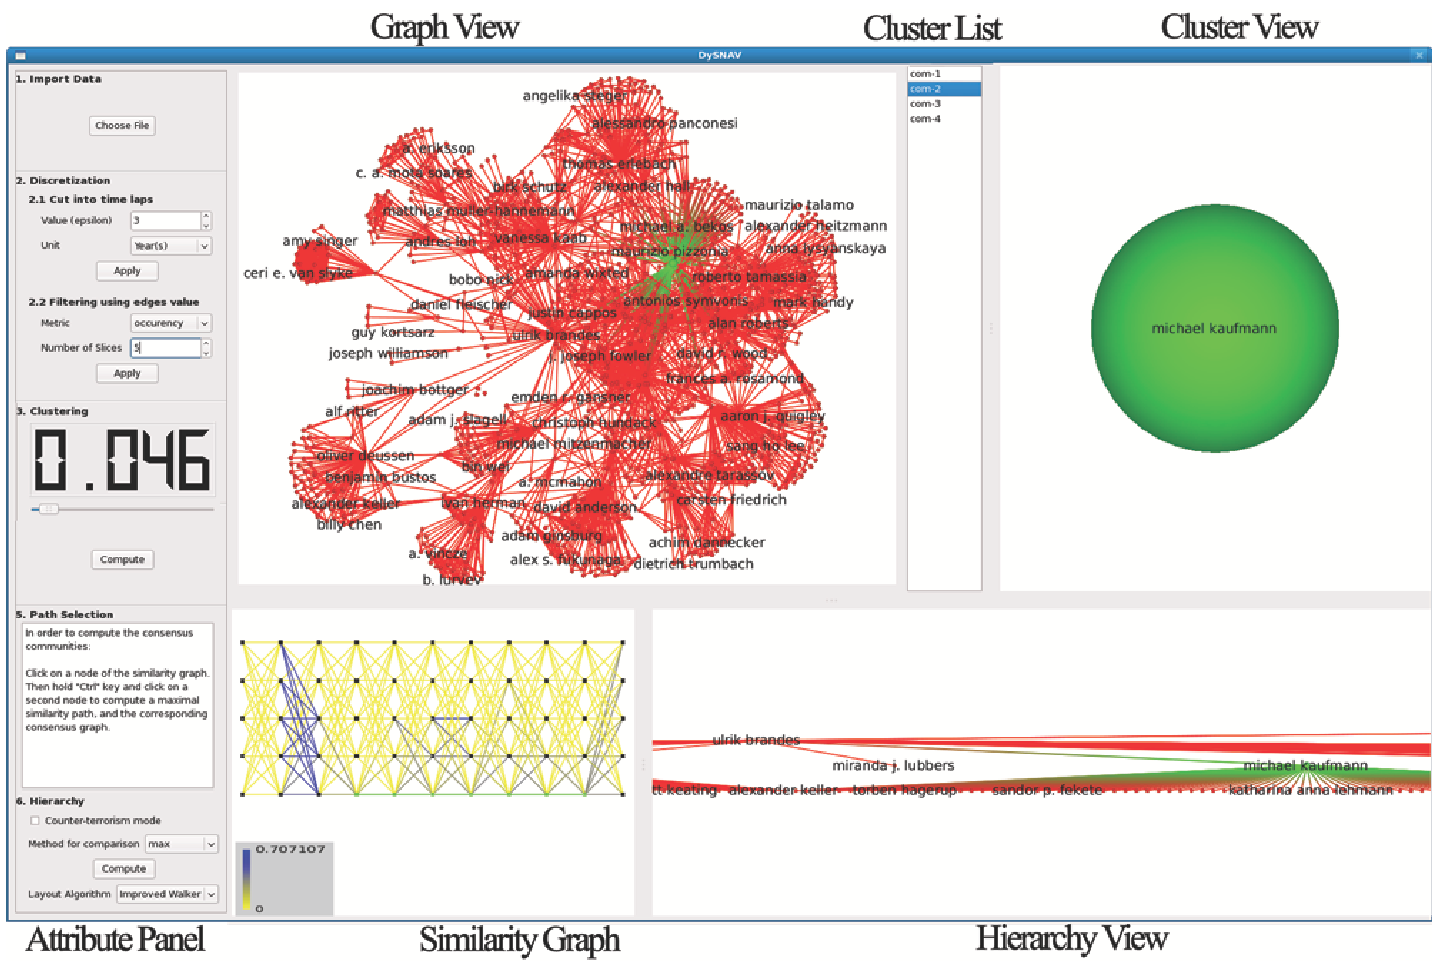
The system operates through four distinct logical layers, moving from raw timestamps to meaningful hierarchies.
1. Discretization & The Strength Metric
The paper uses a "Strength Metric" () to quantify the cohesion of edges based on the number of cycles of size 3 and 4 they belong to. High-strength edges are the "glue" of a community, while low-strength edges are the "bridges" (pivots) between groups.
2. Similarity and Change Detection
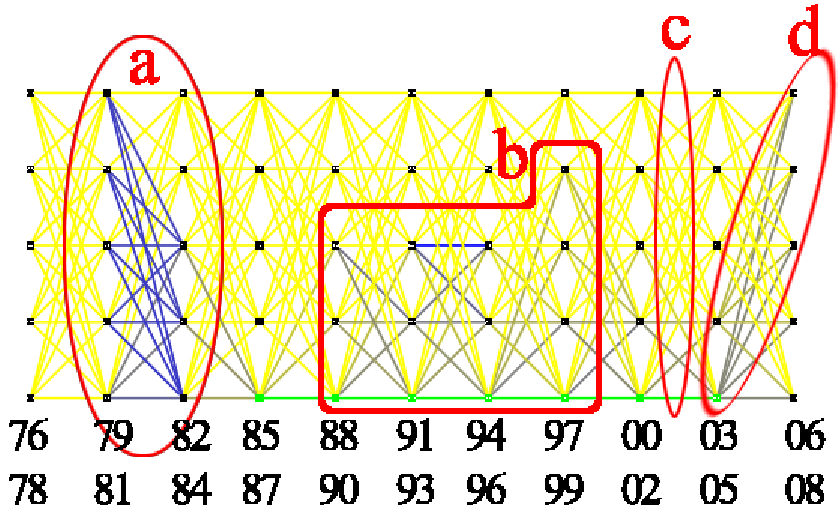
Instead of just comparing if the same people are present, the authors use Cluster Representativeness. If Clustering A is a good representative of Clustering B, the network is stable. A sudden drop in the similarity metric signifies a major real-world event (e.g., a researcher moving universities or a criminal group changing burner phones).
3. The Counter-Terrorism Heuristic (Hidden Leaders)
This is the paper’s most provocative insight. In most networks, the "important" people have the most connections (High Degree Centrality). But in adversarial networks, the Boss stays quiet to avoid detection.
- Gatekeepers/Right-Hands: Have high Delta Efficiency (removing them destroys the flow of information).
- The Boss: Communicates only with the Right-Hands and remains hidden among the "followers" in terms of communication frequency.
The system finds the 3% most efficient nodes (the Right-Hands) and then identifies the single node they all communicate with—revealing the leader.
Experimental Results: Probing the Real World
The authors validated the tool using the VAST 2008 Challenge dataset and a DBLP Co-authorship dataset.
- Academic Lifecycle: By analyzing Ulrik Brandes' co-authorship network, the system detected a clear "instability" period during his move between the University of Sydney and Brown University, followed by a new "consensus community" once he settled at the University of Konstanz.
- The Terrorist Bust: In the fictitious Catalano/Vidro data, the tool identified that a major structural change occurred between Day 7 and 8. It successfully isolated Node 200 as the leader because it was the only node with low communication "noise" that maintained stable links to all high-efficiency gatekeepers (Nodes 1, 2, and 5).
Critical Insight & Conclusion
The DySNAV system proves that network topology is more telling than individual activity. By focusing on "consensus communities"—groups that remain stable across multiple time intervals—researchers can filter out the noise of day-to-day interactions to see the true organizational skeleton.
Limitations: The system relies heavily on the "discretization factor" (). If the time windows are too large, you lose detail; if too small, the clusters become too noisy to compare. Future work involving overlapping time windows (sliding windows) could provide a more continuous view of social evolution.
Takeaway: In the age of big data, the most influential person in a network isn't always the one shouting the loudest (highest degree); often, it's the person whose removal would silently cause the network to collapse.