
Decoding Influence: A Comparative Deep-Dive into 14 Social Network Centrality Measures
Comparative Study of Centrality Measures on Social Networks
This paper presents a comprehensive comparative study of fourteen centrality measures—including Betweenness, Closeness, Percolation, and Leverage centrality—applied to two distinct social networks: a Mumbai terrorist cell and a sexually transmitted infection (STI) transmission network. The study evaluates these measures based on their ability to identify influential nodes and their statistical correlation using Kendall rank coefficients.
TL;DR
In the complex web of social interactions—whether they involve the spread of a virus or the coordination of a covert cell—identifying the "kingpin" is a mathematical challenge. This study examines 14 different centrality measures across two real-world datasets: a Mumbai terrorist cell and an STI transmission network. The verdict? While most math paths lead to the same top influencers, "Leverage Centrality" provides a unique perspective on local leadership that others miss.
The "Central" Problem: Too Many Metrics, Not Enough Context
In Social Network Analysis (SNA), we often ask: Who is the most important person in this group? The answer depends entirely on how you define "important."
- Is it the person with the most contacts (Degree)?
- The person who acts as a bridge for information (Betweenness)?
- Or the person who can reach everyone the fastest (Closeness)?
Prior works often rely on a few "usual suspects." This paper breaks that mold by testing 14 diverse measures, categorized into a functional taxonomy:
| Category | Logic | Examples |
|---|---|---|
| Geodesic Path | Importance based on being on the shortest path. | Betweenness, Percolation |
| Distance | Importance based on physical proximity to others. | Closeness, Eigenvector |
| Connectivity | Importance based on raw number of links. | Degree In/Out, Cross Clique |
| Local Influence | Importance based on the node's immediate neighborhood. | Leverage, Semi-local |
Methodology: From Terrorist Cells to Viral Spread
The authors applied these metrics to two high-stakes scenarios:
- Mumbai Attack Network (2006): A directed graph of 13 individuals. Influence here means control over communication.
- STI Network: An undirected graph of 39 individuals. Influence here means potential for disease superspreading.
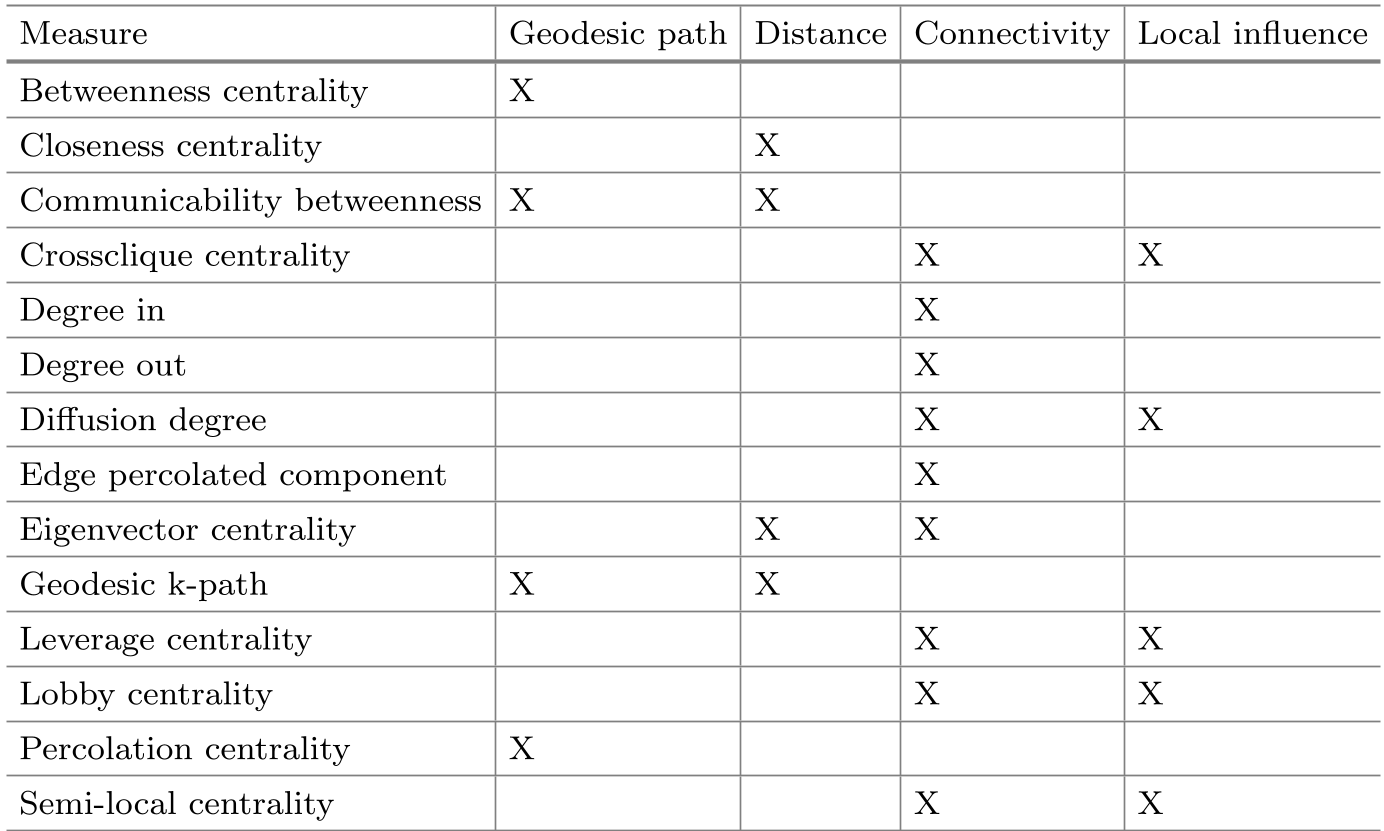 Figure 1: The taxonomy of the 14 centrality measures used in the study.
Key Insights: Are All Measures Created Equal?
1. The "Top-Node" Consensus
One of the most striking findings was the consistency at the top. For the terrorist network, Node 2 was ranked as the most influential by every single measure (BC, CL, DI, DO, etc.). Similarly, in the STI network, Nodes 8 and 26 consistently hovered at the top. Insight: If your goal is simply to find the #1 leader, the specific mathematical model you choose might not actually matter that much—the network structure speaks for itself.
2. The Divergence of Non-Predominant Nodes
Where do the measures disagree? On the "middle-tier" nodes. For nodes that aren't obvious leaders, the rankings fluctuated based on whether the measure was Global (looking at the whole graph) or Local (looking at immediate neighbors).
3. The Outlier: Leverage Centrality (LC)
The study highlighted Leverage Centrality as a unique metric. While Closeness and Semi-local centralities showed high correlation with almost every other measure, LC frequently showed low or no significant correlation. Why? LC measures the degree of a node relative to its neighbors. It identifies someone who has much more influence than their peers, essentially acting as a local "boss," even if they aren't globally central to the entire network.
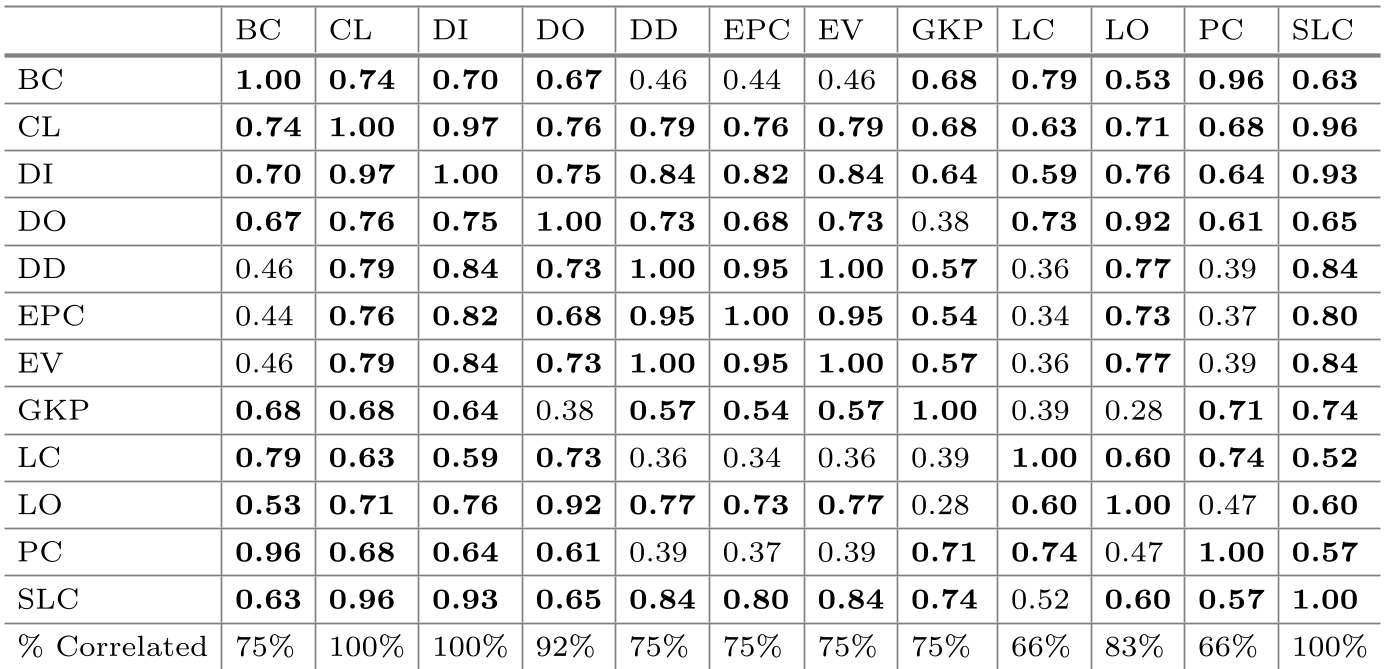 Figure 2: Kendall correlation matrix showing how different measures relate. Note that CL and DI are correlated with 100% of other measures.
Critical Analysis & Future Outlook
The paper confirms that for identifying primary targets in social networks, standard measures like Closeness (CL) or Degree In (DI) are highly reliable and "universal."
Limitations:
- Small Sample Size: The networks studied ( and ) are tiny by modern standards. In a network of millions (like X/Twitter), the computational complexity of measures like Communicability Betweenness becomes a major bottleneck.
- Static vs. Dynamic: The study treats these networks as static snapshots. However, in an STI outbreak or a terrorist plot, the network evolves over time.
Future Directions: The authors suggest deepening the study of Percolation Centrality, which introduces a "time factor" into the diffusion process. Understanding when a node becomes influential is the next frontier in network science.
Conclusion
This comparative study serves as a vital sanity check for researchers. It proves that while we have a plethora of mathematical tools, they largely "agree" on the most important actors. However, for nuanced roles—like local leaders or specialized bridges—the choice of a "local influence" measure like Leverage Centrality can reveal hidden structural layers that traditional metrics overlook.