
Brittle Webs and Robust Social Ties: Decoding Network Sensitivity
Comparing the Sensitivity of Social Networks, Web Graphs, and Random Graphs with Respect to Vertex Removal
This study evaluates the sensitivity of social networks, web graphs, and random graphs (ER, BA, WS, CF) to vertex removal. It employs relative harmonic diameter change and rank correlation of centrality measures as comparison methods across various removal strategies. The research confirms that social networks are significantly more robust than web graphs in medium-sized real-world datasets.
TL;DR
Not all networks are created equal when parts of them are removed. This study reveals that social networks are remarkably "tough" under attack, while web graphs (hyperlink structures) collapse rapidly. Using medium-sized real-world data and simulated models, the authors show that while the target matters, the specific mathematical strategy used to pick that target often matters less than we think.
Background Positioning
In the landscape of network science, this work serves as a critical bridge. It validates findings previously seen only in massive-scale networks (like the work of Boldi et al.) and applies them to medium-sized datasets. It sits at the intersection of Robustness Analysis and Graph Theory, providing a "stress test" for different network topologies.
Problem & Motivation: The "Attack" Gap
Why do some networks survive a massive failure or targeted attack while others disintegrate? Previous studies often used different "yardsticks" (comparison methods) and "weapons" (removal strategies), making it hard to compare results. The authors noticed that while social networks and web graphs both share "heavy-tailed" degree distributions, they react to vertex removal in fundamentally different ways. They set out to find if this sensitivity is a product of the network's nature or just a quirk of its size.
Methodology: The Framework of Destruction
The researchers used a two-step process: Removal and Comparison.
1. Removal Strategies
They didn't just remove nodes at random. They used:
- Centrality Measures: Removing the "VIPs" first (Betweenness, Closeness, Degree, PageRank).
- Label Propagation (LP): Removing nodes that act as "bridges" between communities.
2. Comparison Methods
To see how much the graph changed, they used:
- Relative Harmonic Diameter Change ( ): A metric that combines path length and connectivity.
- Centrality Rank Correlation: Checking if the relative importance of remaining nodes stayed the same.
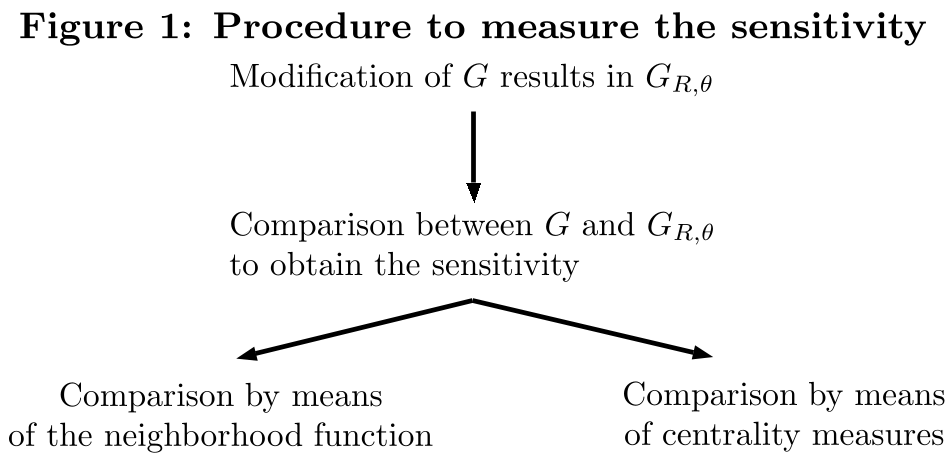 Figure 1: The overall workflow from source graph to modified graph evaluation.
Key Insights: Social vs. Web
The contrast found in real-world data was stark.
- Social Networks (Hamsterster, Brightkite, Slashdot): These are "Robust." Even when 30% of the edges were removed via the most aggressive strategies (like Betweenness), the harmonic diameter only shifted slightly.
- Web Graphs (Google, Stanford, NotreDame): These are "Fragile." Targeted removal leads to catastrophic increases in distance between nodes. For the NotreDame dataset, the sensitivity was orders of magnitude higher than social networks.
Interestingly, when using Centrality Correlation as a measure, the distinction between Social and Web graphs blurred. This suggests that while a web graph's connectivity is easily destroyed, the relative hierarchy of its nodes is somewhat more stable.
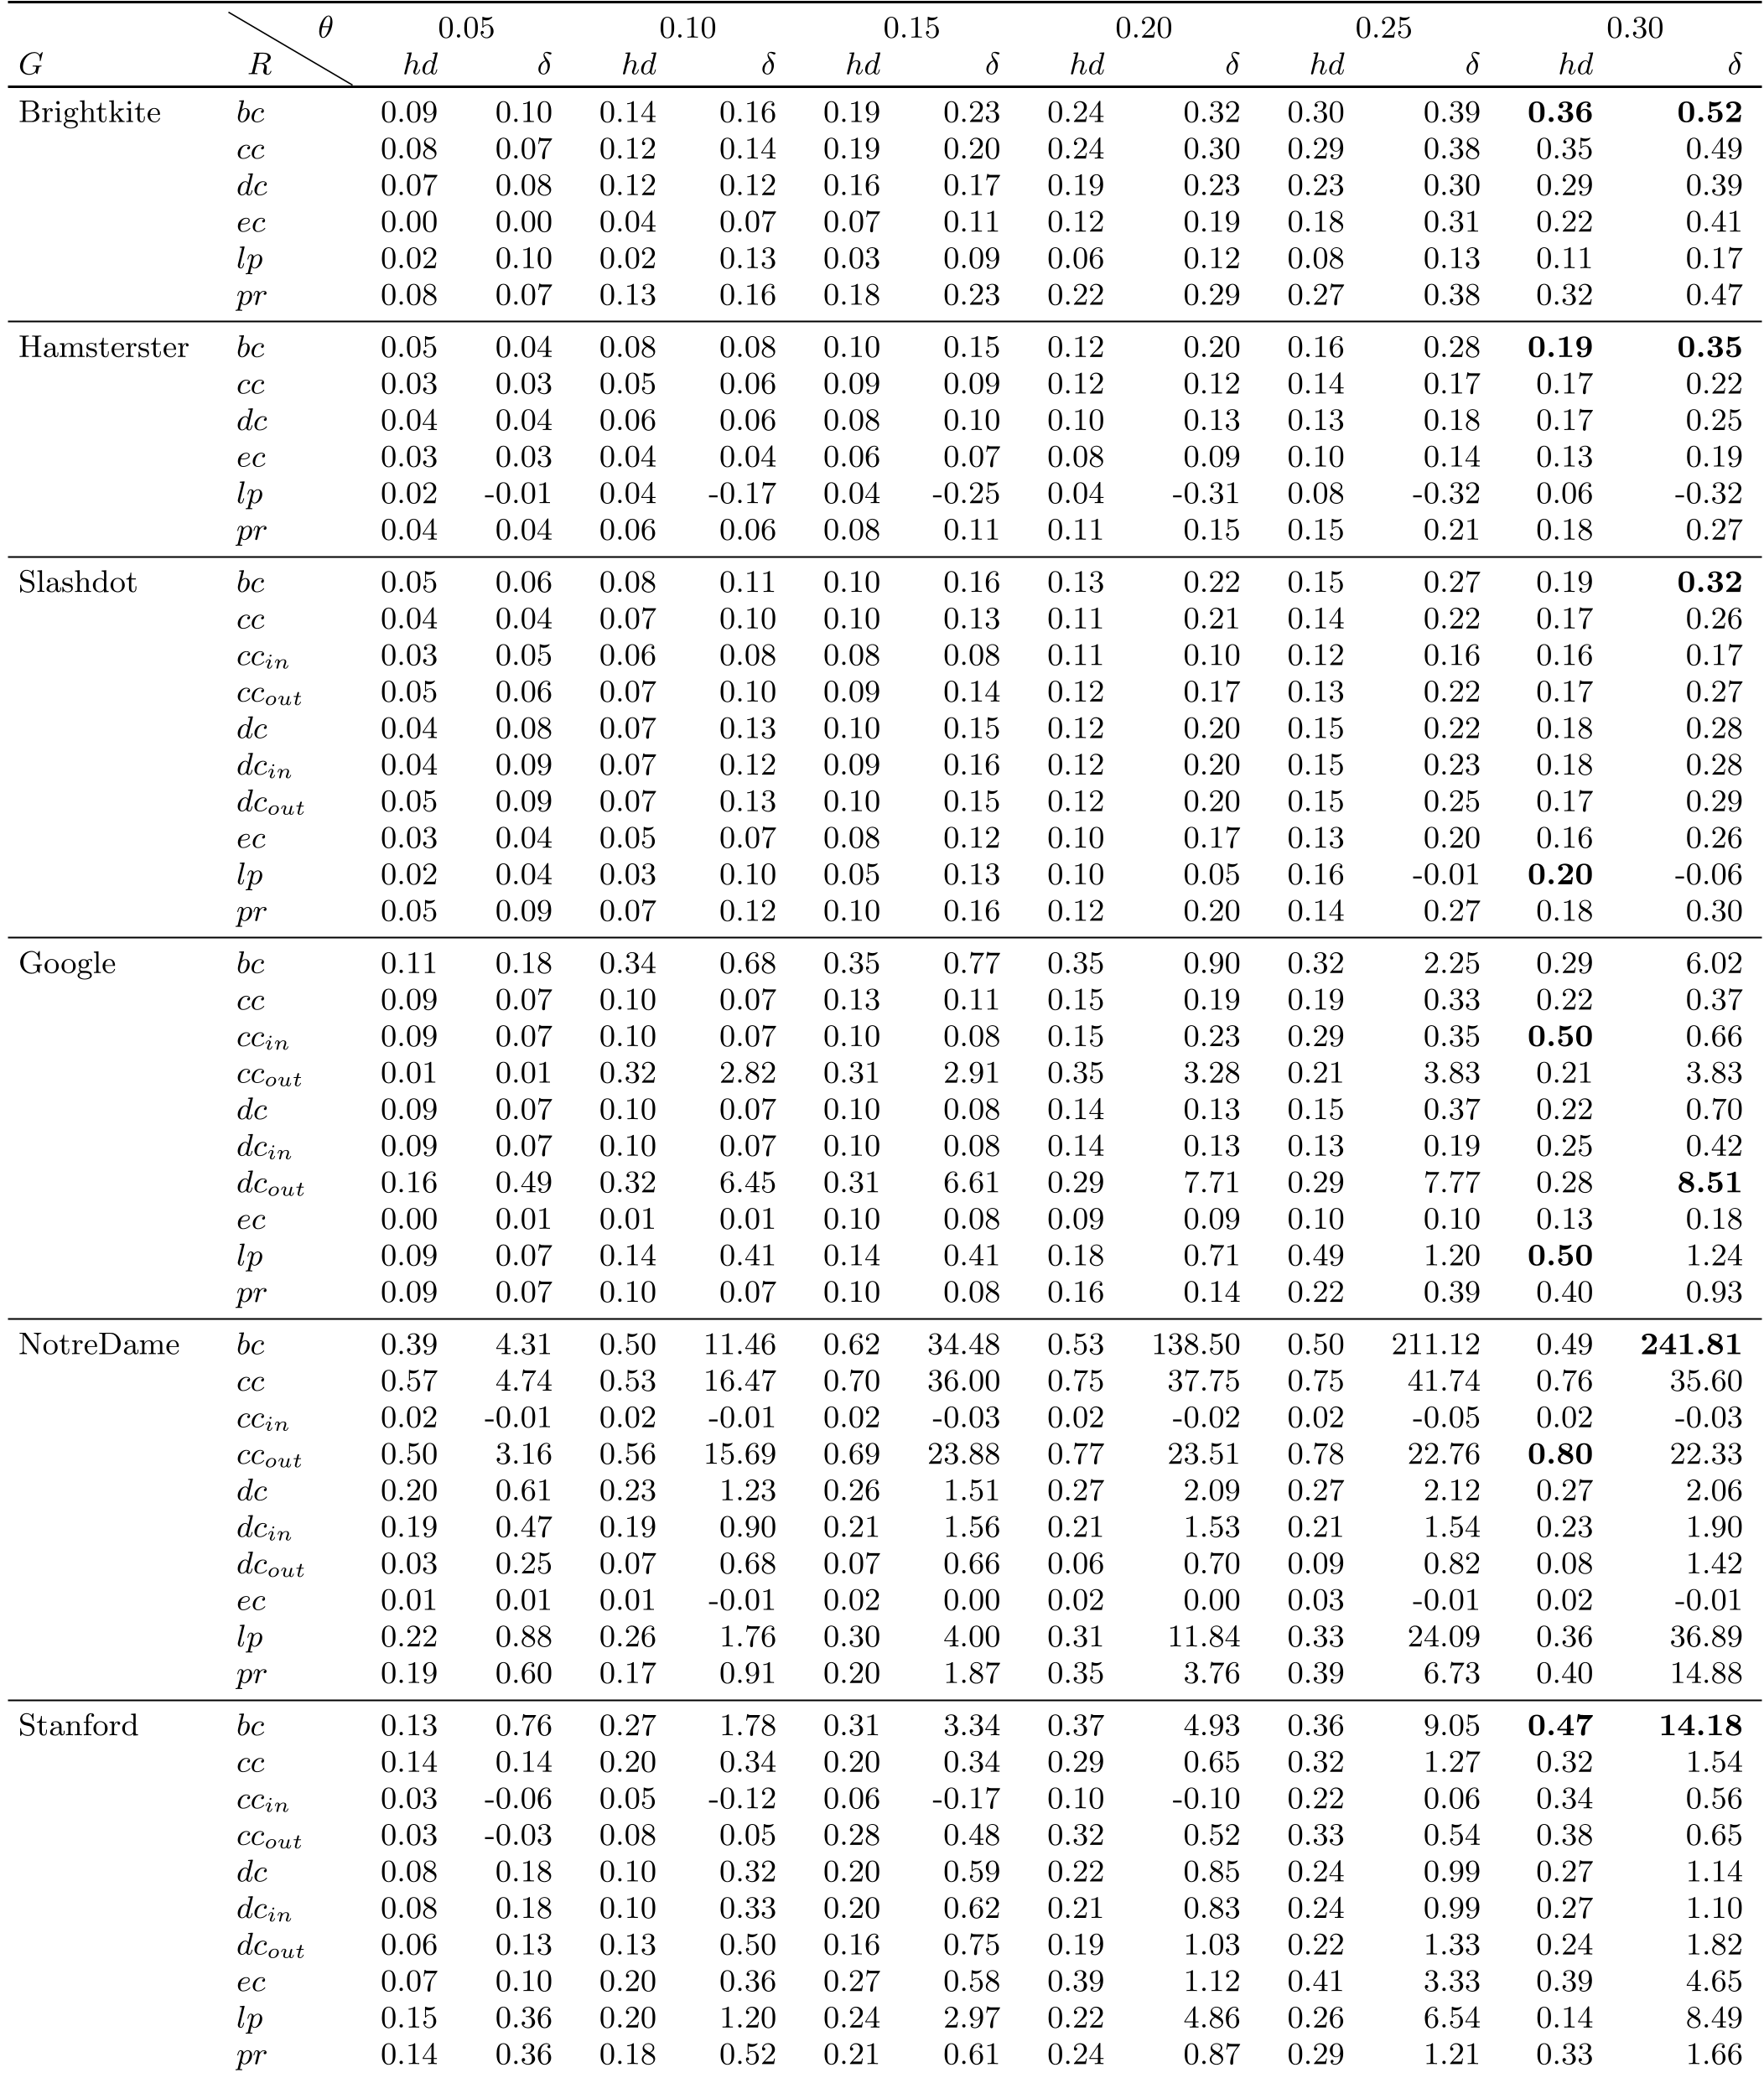 Comparison of sensitivity ( and ) across different networks. Web graphs (bottom three) show extreme values compared to social networks (top three).
Lessons from Simulated Graphs
By testing Erdos-Renyi (ER), Barabasi-Albert (BA), and Watts-Strogatz (WS) models, the authors found:
- Strategy Indifference: For most random models, it didn't matter which centrality measure you used to attack (Degree vs. PageRank). If it wasn't a random attack, the damage was roughly the same.
- Size Matters: Smaller graphs are generally more sensitive to removal than larger ones of the same type.
- The "Random" Threshold: There is a massive jump in damage when moving from random removal to any systematic centrality-based removal.
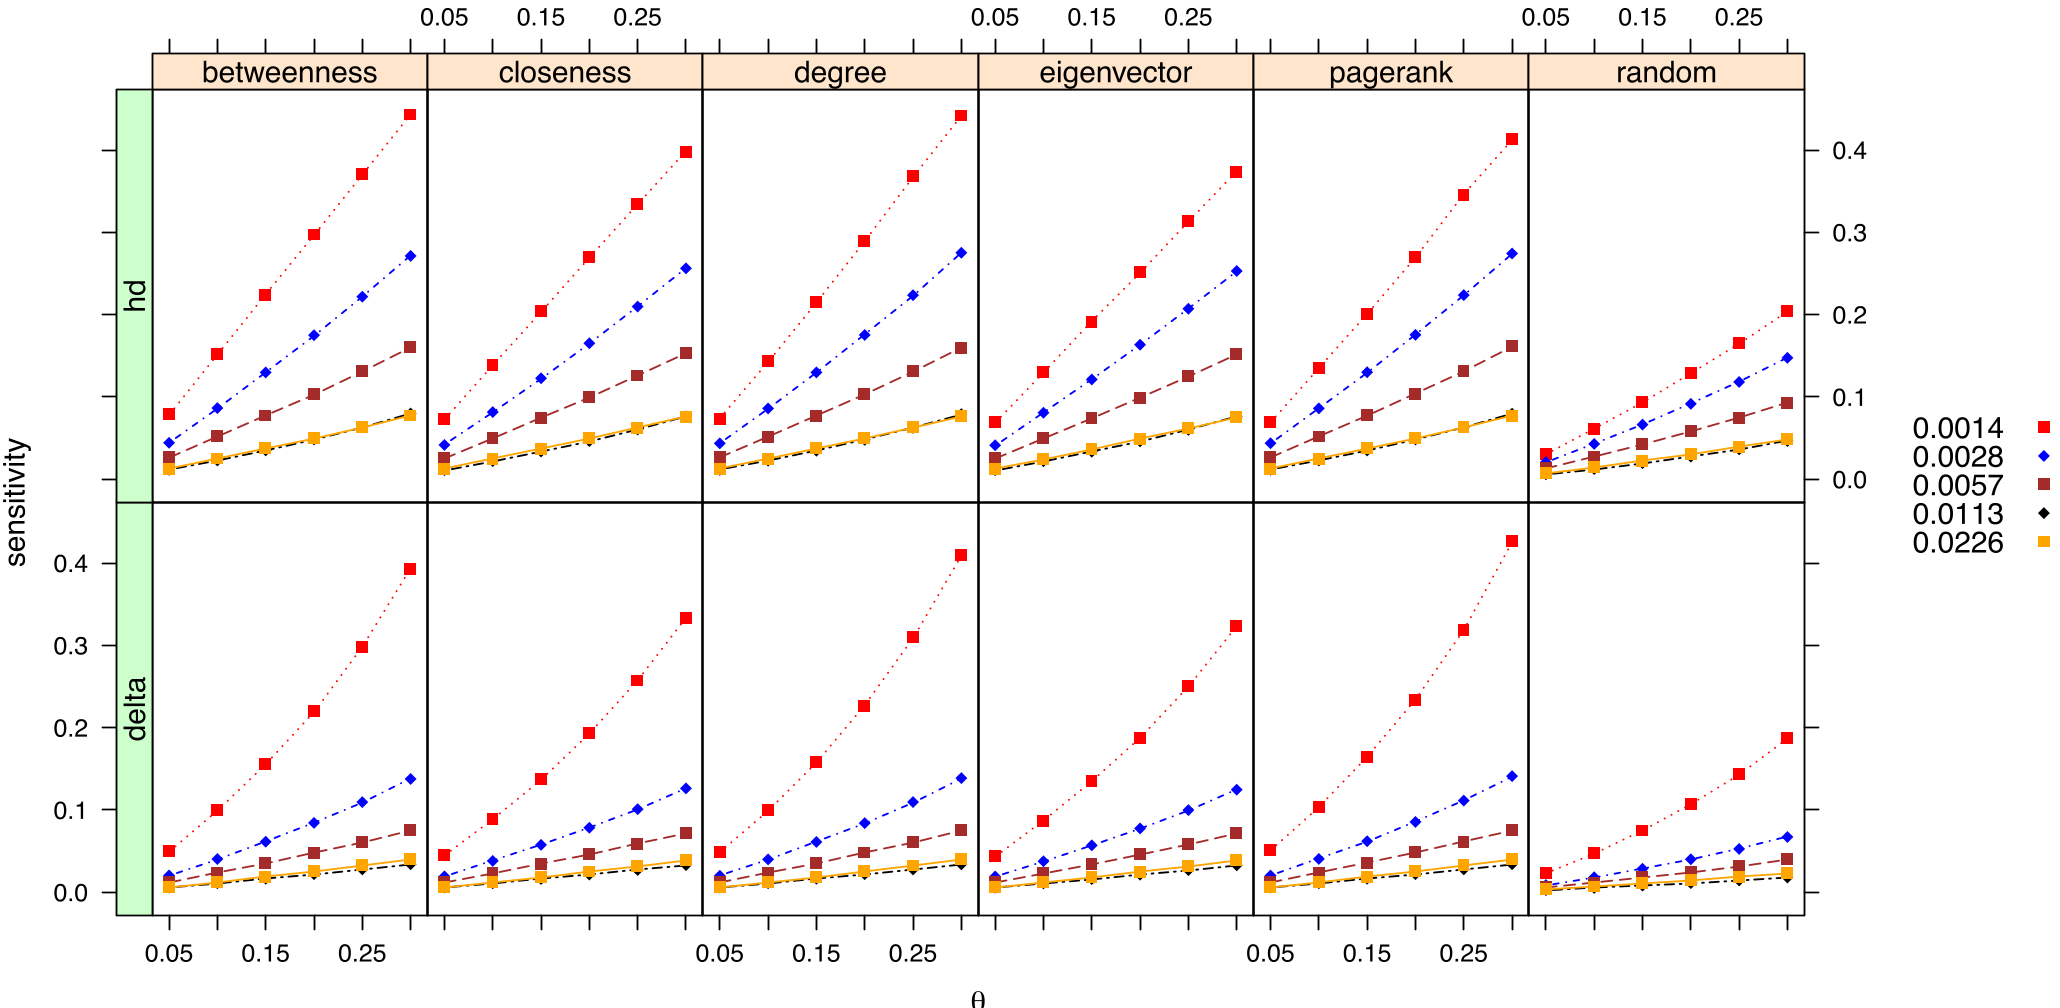 Figure 4: Sensitivity in ER graphs shows that decreasing edge density (lower p) increases vulnerability.
Critical Analysis & Conclusion
This paper provides a sobering look at the vulnerability of the web. It suggests that our online information structures are far more susceptible to targeted disruption than our interpersonal social fabrics.
Limitaitons: The authors acknowledge that while they looked at removing nodes, they didn't look at adding them (growth). Furthermore, the Label Propagation strategy proved unstable for certain types of web graphs, suggesting that community-based attacks need more robust algorithms.
Future Outlook: For those building resilient systems, the takeaway is clear: Social topologies possess an inherent "structural insurance" that web-like structures lack. Understanding the physics of this social robustness could be the key to designing more resilient digital infrastructures.