
Beyond the Black Box: How Open Learner Models Ignite Student Engagement
Complementing educational recommender systems with open learner models
This paper introduces a method to enhance Educational Recommender Systems (ERSs) by integrating Open Learner Models (OLMs) to provide visual justifications for recommendations. Using the RiPPLE platform, the authors demonstrate how transforming "black-box" algorithms into transparent, visual knowledge-state maps significantly improves student engagement and trust.
TL;DR
Educational Recommender Systems (ERSs) often fail because they lack transparency. This paper explores the "Complemented Interface" approach—pairing recommendations with Open Learner Models (OLMs). By making the "why" behind a recommendation visible through interactive bar charts, the study found that students spend more time learning and trust the system more, even if the interface feels slightly heavier to navigate.
The "Black Box" Problem in Education
In commercial apps like Netflix or TikTok, black-box recommendations are the norm. However, in education, the goal isn't just consumption—it's reflection and agency. When a student is told to "Try this math problem" without knowing why, they lose a chance to self-regulate their learning. This lack of transparency leads to "trust rot," where students ignore recommendations they don't understand or perceive as unfair.
The Solution: A Complemented Interface
The authors utilized RiPPLE, a crowdsourced adaptive learning platform. They split students into two groups: one saw a standard resource list, and the other saw their resources alongside a visualization of their own "Knowledge State."
Methodology & Architecture
The OLM in this study isn't just a static graph; it’s a dynamic profile powered by the Elo rating system (commonly used in chess).
- Real-time Updates: As a student finishes a task, their "bar" moves.
- Social Comparison: A line graph shows the cohort average, providing a benchmark for self-evaluation.
- Color Coding: Red (inadequate), Yellow (adequate), and Blue (mastery) provide immediate intuitive feedback.
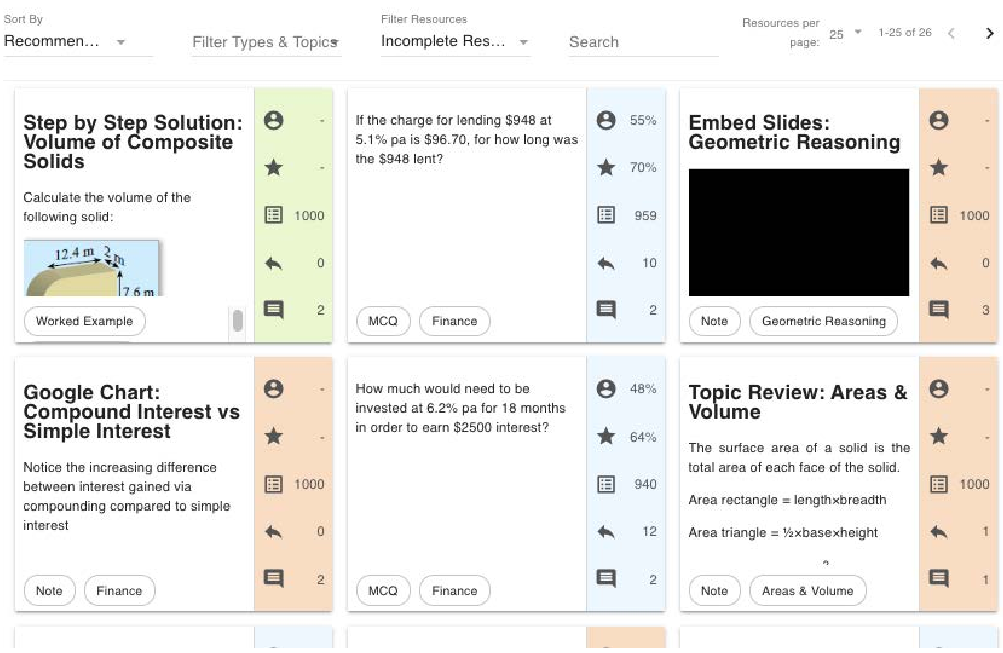 Figure: The Complemented Interface effectively situates the recommendation rationale (the OLM bar charts) directly above the suggested activities.
Key Results: Engagement vs. Complexity
The Randomized Controlled Trial (RCT) yielded fascinating insights:
- Sticking Power: Students in the complemented group had significantly longer sessions (25 minutes vs. 20 minutes on average).
- Trust Gains: Students felt the system was "fairer" and were more likely to want to use it in other courses.
- The Complexity Tax: Interestingly, the Non-Complemented interface was rated as "easier to navigate." This suggests that transparency comes at the cost of cognitive load—users have to learn how to read the model.
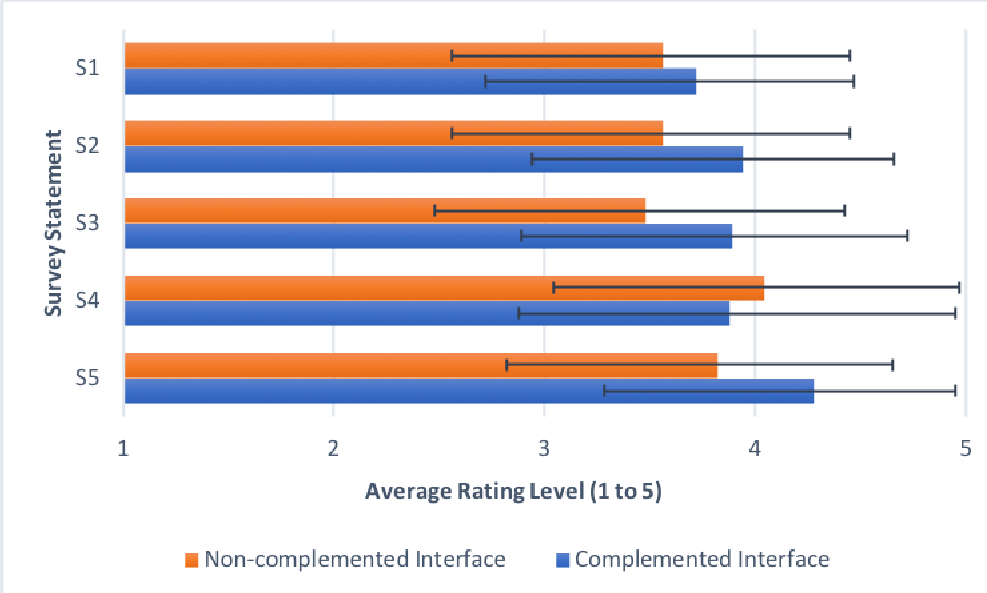 Figure: Survey data highlights significant leads in System Acceptance (S5) and Perceived Fairness (S2) for the Complemented group.
The "Rating Anxiety" Insight (Critical Analysis)
The paper reveals a peripheral but vital human insight: Rating Anxiety. Some students viewed the OLM as a "score" to be protected. They avoided difficult recommended questions because they didn't want to "risk a hit to their rating."
This suggests a fundamental Future Work direction: we must design "Sandboxes" or "Safe Spaces" in ERSs. If a system is always "watching" and "rating," it might inadvertently discourage the very risk-taking that is essential for deep learning.
Conclusion: Principles for Future ERS
To truly support learners, ERSs must move beyond pure accuracy. The authors propose four pillars for future tech:
- Digital Literacy: Teach students how to read their models.
- Transparency: Explain the approximation logic.
- Voice: Allow students to "negotiate" or disagree with the model.
- Safety: Provide low-stakes practice zones.
By opening the learner model, we don't just improve the algorithm; we empower the student.