
Beyond Hierarchies: How Visualization Turns Organizational Goals into Social Learning Scaffolds
12135_Comprehension and Learning of Social Goals Through Visualization.
This paper introduces the concept of "Social Goals"—transparent organizational objectives—and evaluates two novel interactive visualizations (GVis and TVis) designed to enhance their comprehension. The study demonstrates that graph-based and timeline-based views significantly outperform traditional faceted browsing in accuracy and support for social learning.
TL;DR
Organizational goals are evolving from top-down mandates into "social objects" that encourage collaboration. This research demonstrates that replacing traditional list-based goal managers with graph-based (GVis) and timeline-based (TVis) visualizations significantly improves how employees comprehend complex goal structures and fosters "social learning"—the ability to learn how to set and pursue goals by observing others.
The Problem: The "Black Box" of Corporate Objectives
In most organizations, goals are buried in spreadsheets or rigid hierarchical charts. While modern "Enterprise 2.0" platforms (like 7Geese or Work.com) offer search and filtering, they possess a critical flaw: they lack relational context.
The authors argue that personal goals are deeply intertwined with social networks. Without a way to see implicit connections (e.g., goals sharing the same topic) or explicit dependencies, employees suffer from information overload and a lack of "goal congruence"—the feeling that their work actually matters to the broader organization.
Methodology: Mapping the Social Goal Space
To bridge this gap, the researchers moved beyond the "Faceted Goal Browser" (FGB) and introduced two distinct visual metaphors:
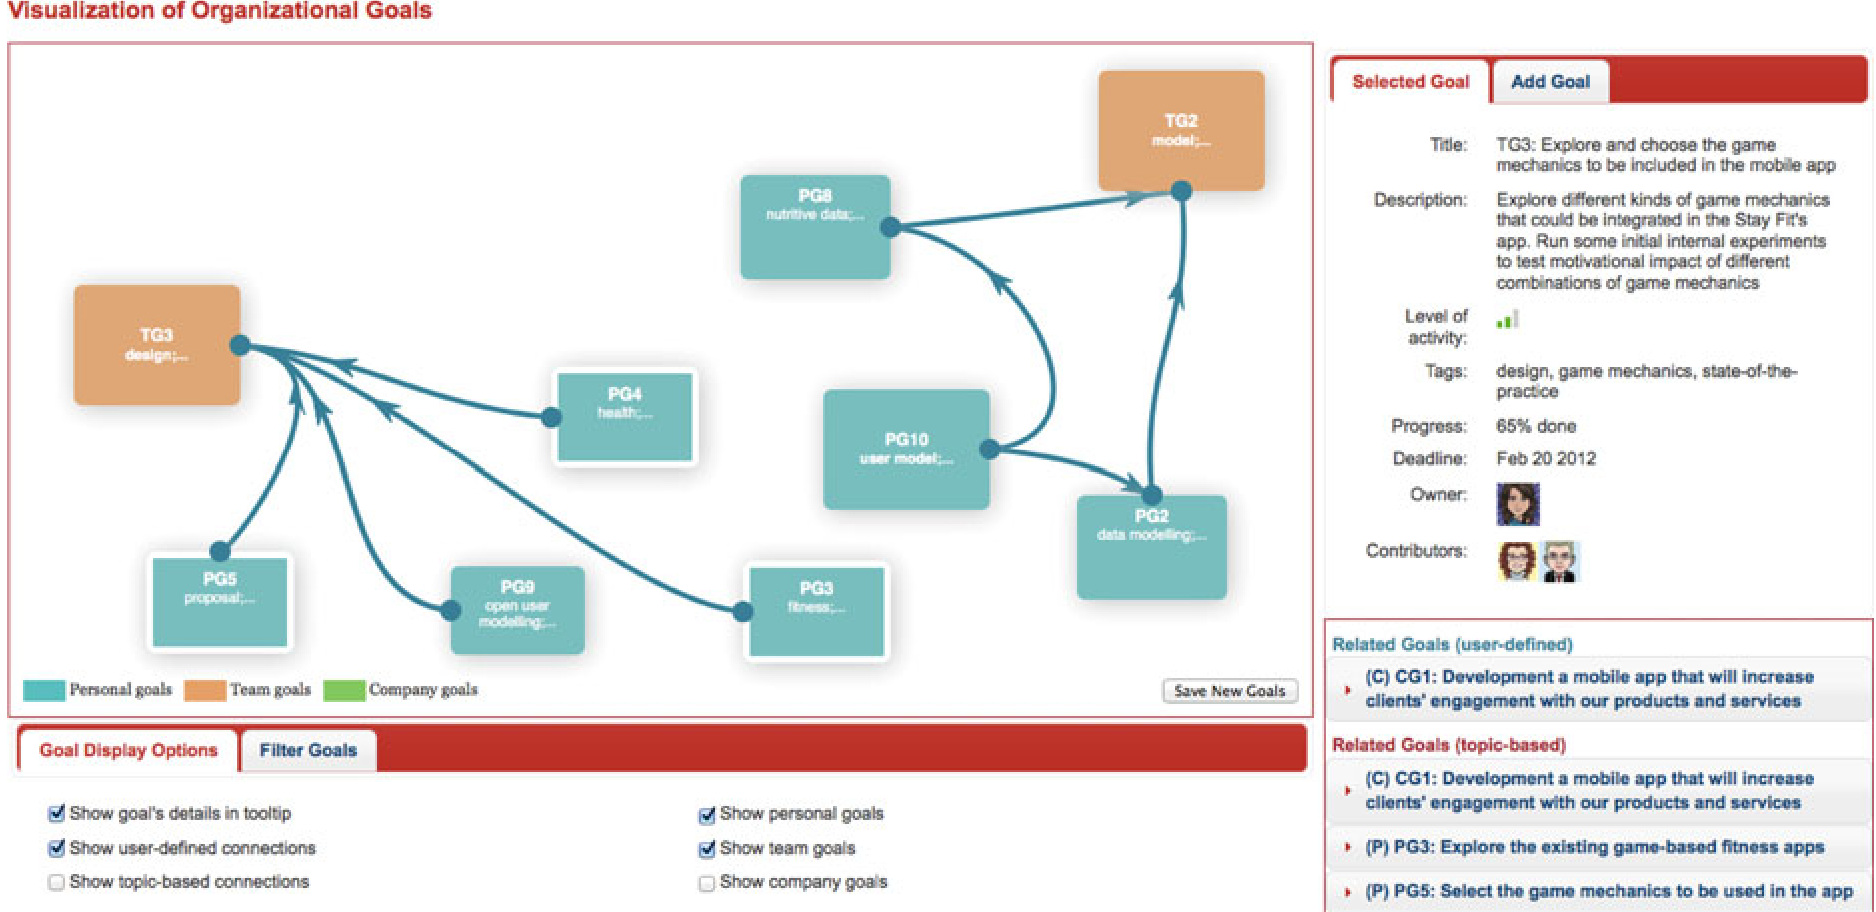
1. The Graph-Based Visualization (GVis)
GVis treats goals as nodes in a network. It doesn't just show who reports to whom; it visualizes:
- Explicit Ties: Direct links created by users.
- Implicit Ties: Connections inferred from shared tags or topics.
- Social Weight: The size of a node reflects how many people are collaborating on that specific goal.
2. The Timeline-Based Visualization (TVis)
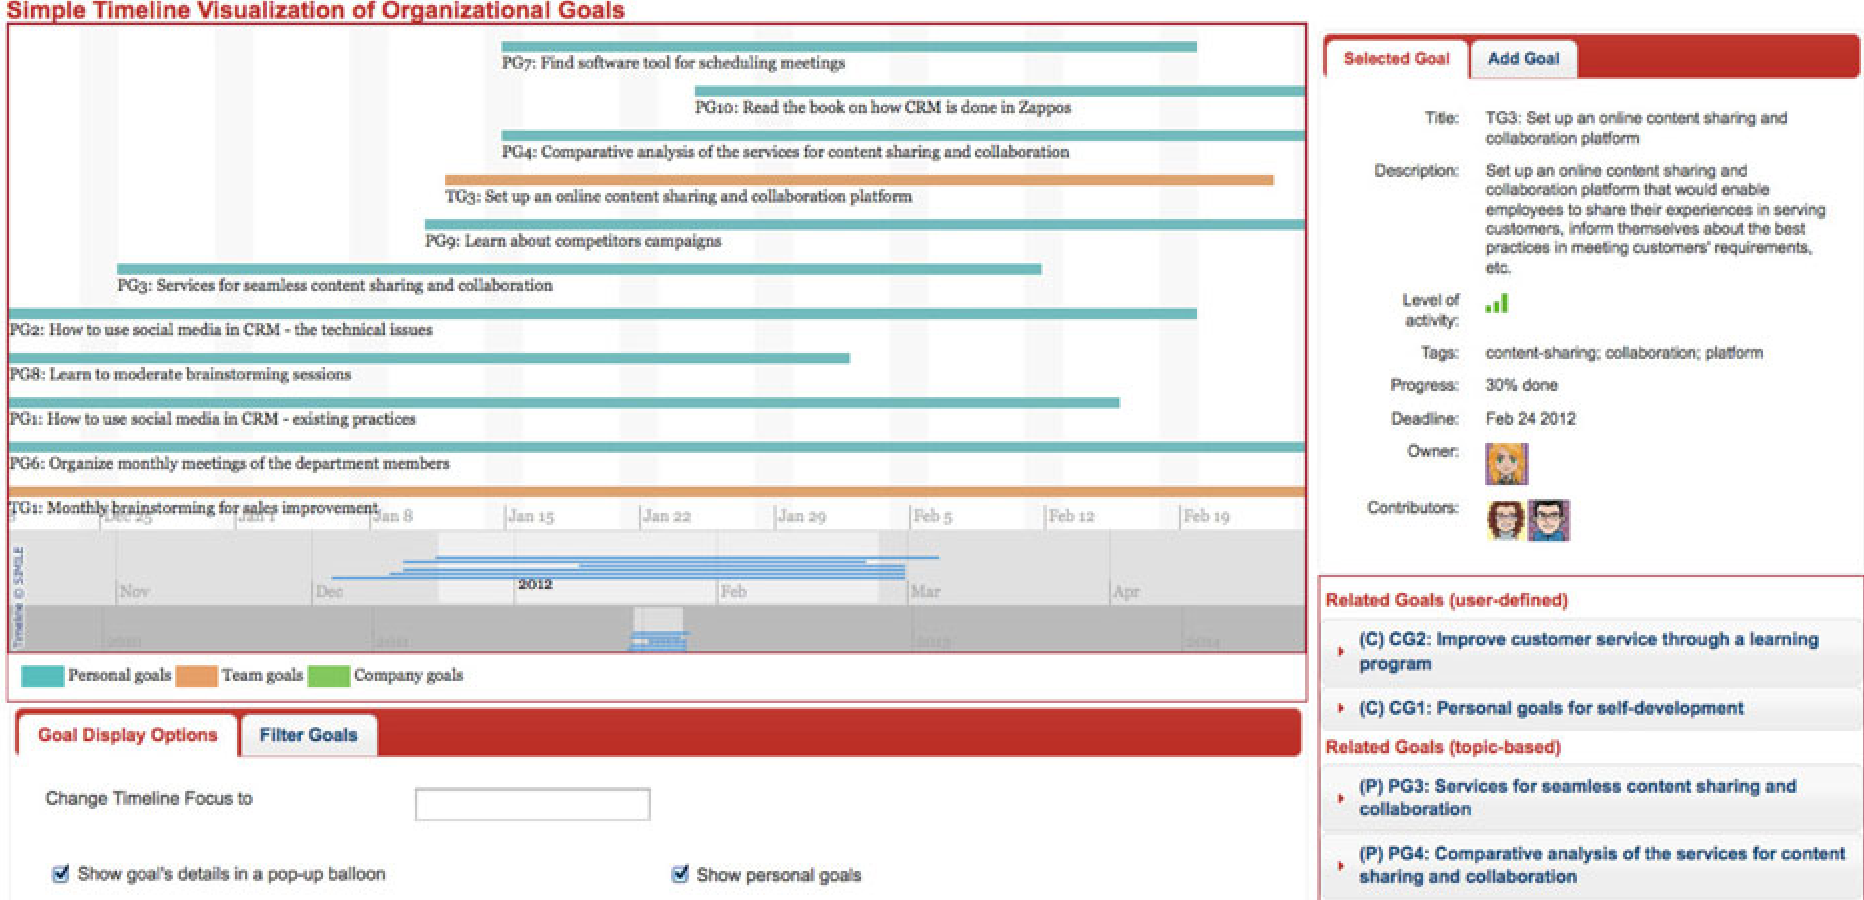
TVis focuses on the temporal dimension, representing goals as stripes on a calendar. This allows users to quickly identify:
- Goal Load: Periods of time with too many competing objectives.
- Urgency: Using spatial positioning to signal upcoming deadlines.
Experimental Results: Accuracy over Speed
The researchers conducted a between-subjects study comparing GVis, TVis, and the standard Faceted Goal Browser (FGB).
Key Findings:
- Accuracy Boost: Both GVis and TVis significantly outperformed FGB in overall comprehension accuracy.
- Implicit Relations: Visualizations were vastly superior at helping users identify topic-based connections (e.g., TQ7 in the study saw 0% accuracy for FGB compared to nearly 70-85% for visualizations).
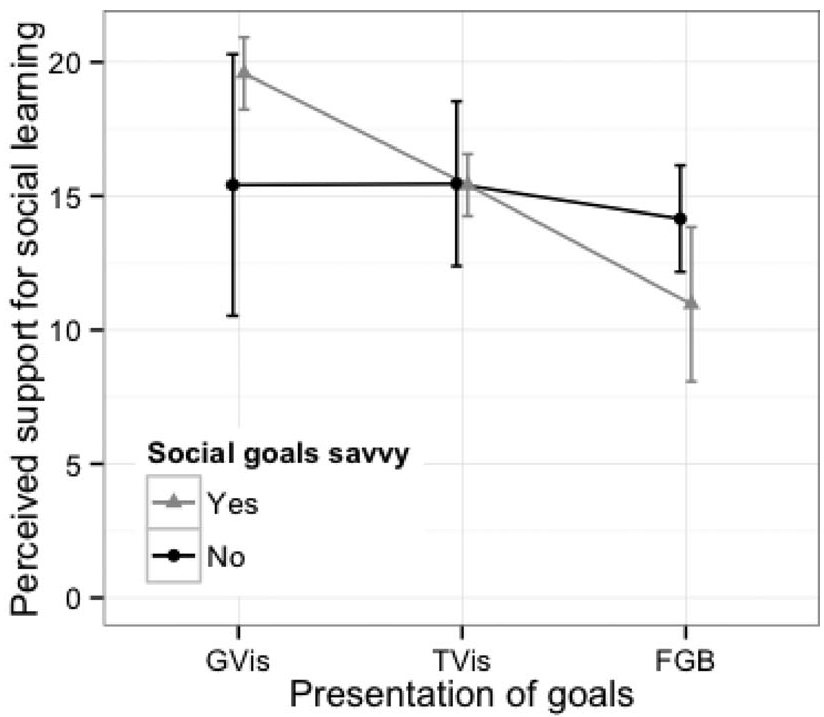
- Social Learning: GVis was the only method that significantly improved "perceived social learning." Participants felt that seeing the goal network allowed them to better align their own personal aims with the organization's mission.
Critical Insight: Visualizations as Scaffolds for Culture
The most profound takeaway is the link to Social Cognitive Theory. By making goals transparent and visual, an organization creates a "vicarious learning" environment. Newcomers can "observe" the successful goal-setting patterns of senior R&D staff simply by exploring the graph.
Limitations & Future Work
The study was limited by a small sample size (N=39) and a relatively small goal set (15 goals). In a massive corporation with thousands of goals, these graphs might become "hairballs." The authors suggest "Focus + Context" paradigms (zooming from abstract to detail) as the next frontier for large-scale goal visualization.
Conclusion
This work confirms that how we present goals is just as important as the goals themselves. By shifting from lists to graphs, organizations can transform a dry administrative task into a dynamic engine for social learning and cultural alignment.