
Beyond Averages: Decoding Educational Complexity via Computational Methods
Using Computational Methods to Analyze Educational Data
This paper outlines a special session proposal for the FIE 2019 conference, focusing on the integration of computational methods—specifically clustering, interactive visualization, and permutation tests—into educational research. It advocates for transitioning from traditional aggregate statistics to person-centered analyses using R programming to decode complex learning behaviors.
TL;DR
This work proposes a paradigm shift in educational research, moving away from aggregate statistics toward Computational Pattern Recognition. By utilizing R-based clustering, interactive visualizations, and permutation tests, the authors provide a toolkit for educational researchers to uncover hidden structures in qualitative data, such as how different groups of students navigate modeling and simulation tasks.
Background: Education as the Next Frontier for Computation
For decades, educational research has relied on traditional frequentist statistics—often aggregating student performance into a single mean. However, learning is a non-linear, complex phenomenon. As the authors argue, computation is now the "third pillar" of science, joining theory and experimentation. The core motivation here is to bridge the gap between high-level computer science methods and grounded educational theory.
Problem & Motivation: The "Uniform Group" Fallacy
The authors identify a critical bottleneck in the field: The Aggregation Bias. Traditional methods treat students as if they learn the same way, obscuring the "why" and "how" of individual progress. While disciplines like Learning Analytics (LA) and Educational Data Mining (EDM) have emerged, there remains a disconnect:
- Computer Scientists often build sophisticated models that lack "pedagogical soul" (theory).
- Education Researchers possess deep theoretical insights but struggle to process large-scale or high-dimensional qualitative data.
Methodology: Clustering and Visualization as Research Tools
The paper highlights three specific computational pillars intended to modernize qualitative analysis:
1. Automated Group Identification (Clustering)
Instead of manually coding thousands of instances, the authors use K-means clustering to identify groups of students who exhibit similar patterns of metacognitive knowledge. This allows for a "Person-Centered" analysis that is statistically validated but qualitatively meaningful.
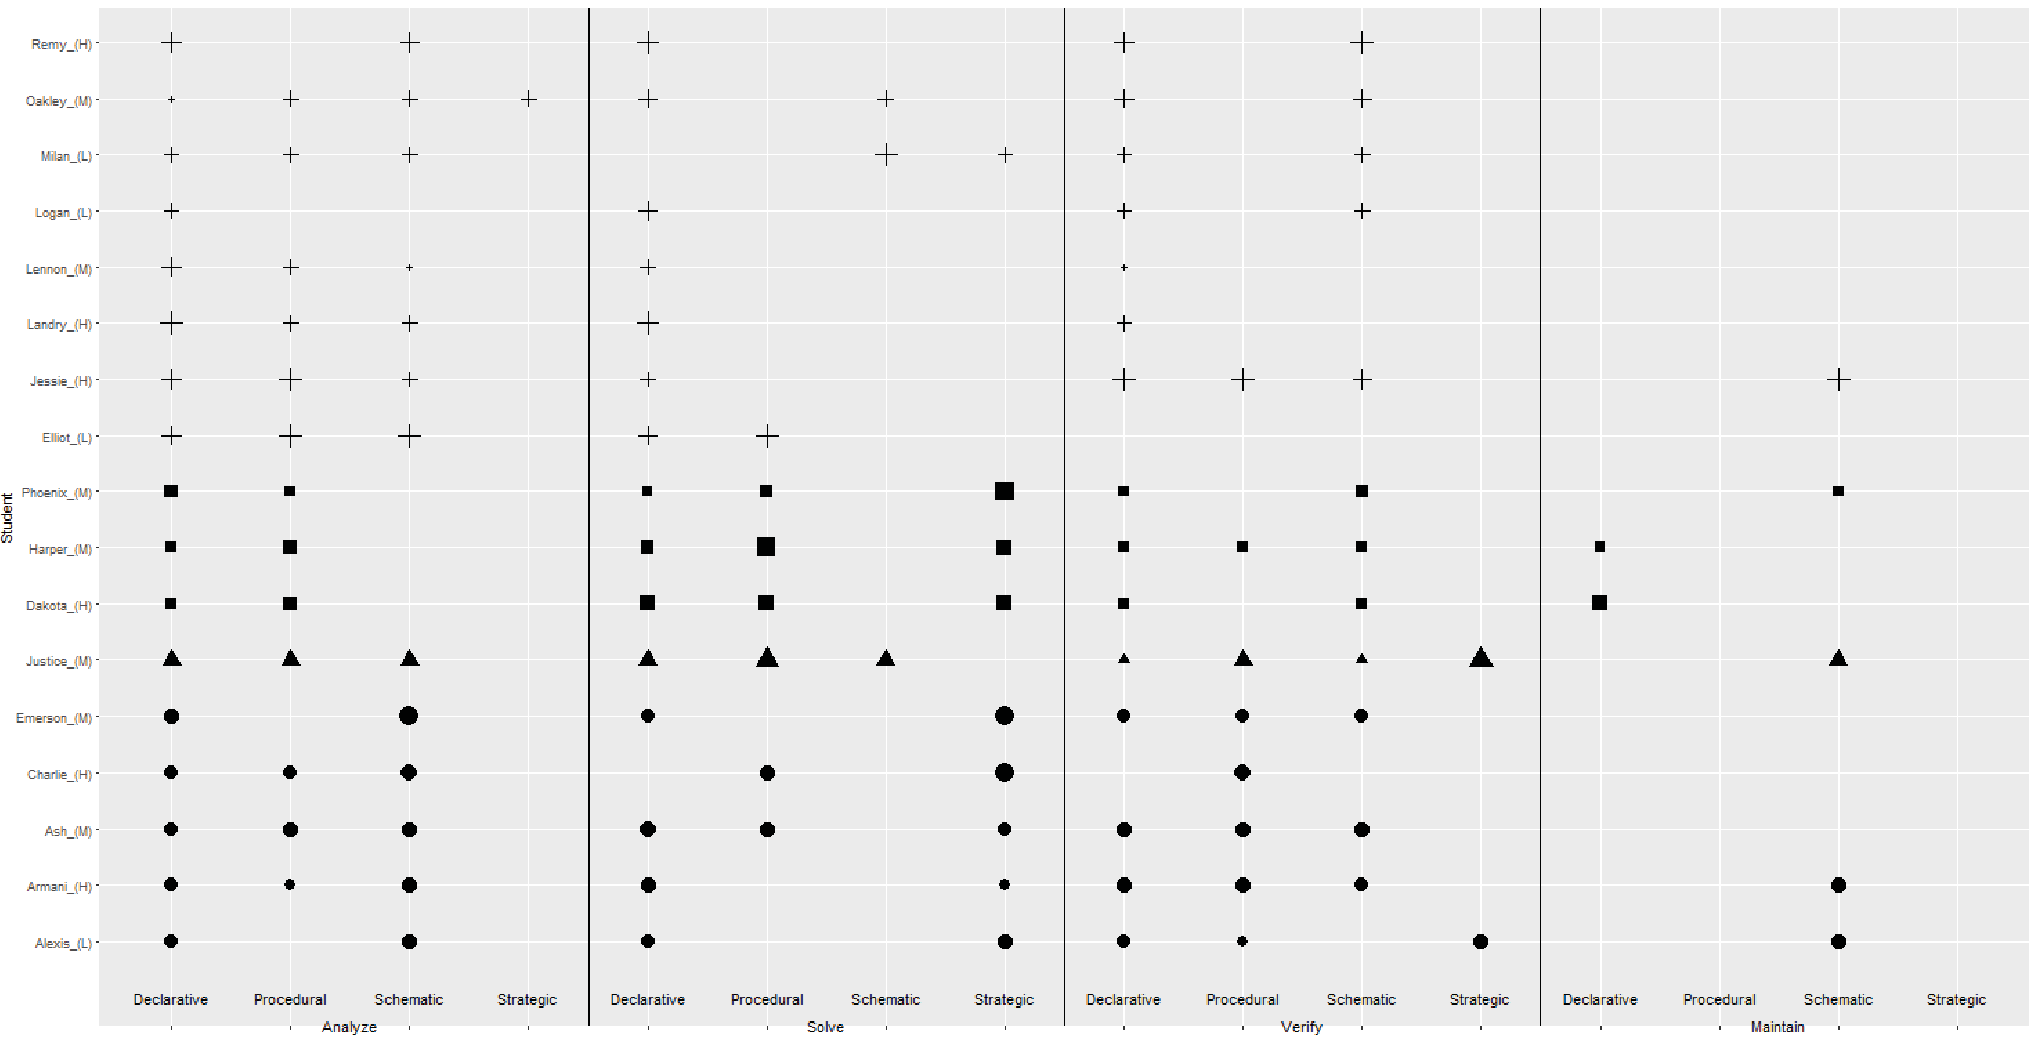 Figure 1: This visualization uses symbol size and shape to represent instances of student knowledge, with groups automatically categorized via K-means clustering.
2. Gap Analysis through Visualization
One of the most striking applications mentioned is the use of computational visualization to conduct systematic literature reviews. By plotting "Visual Sophistication" against "Theoretical Depth," the researchers can mathematically locate "white spaces" in current research—areas where future work is desperately needed.
The R-Programming Implementation
The proposed session isn't just theoretical; it utilizes R and RStudio to democratize these methods. By providing worked examples and tutorials, the authors lower the barrier for non-CS researchers to adopt open-source, reproducible computational workflows.
Experiments & Results: Finding the "Theoretical Gap"
The authors' own literature review (Visual Learning Analytics) showcased the power of these methods. Their heatmaps and scatter plots revealed that very few studies manage to balance complex computational methods with rigorous educational theory.
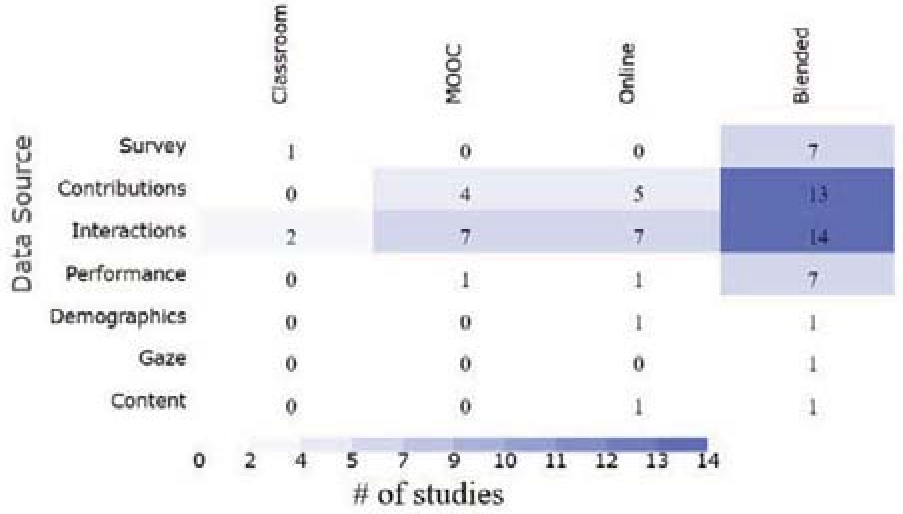 Figure 2: (a) Heatmaps identifying data sources and visualization purposes; (b) Scatter plot revealing the gap between visual sophistication and educational theory grounding.
Critical Analysis & Conclusion: The Road Ahead
The takeaway is clear: Educational research must become interdisciplinary by design.
Key Contributions:
- Methodological Rigor: Introduces Validation Methods (Permutation Tests) to qualitative frameworks.
- Democratization: Provides an R-based bridge for educational specialists to enter the world of data science.
Limitations: While the paper promotes these methods, it acknowledges that "sophistication for the sake of sophistication" is a trap. The ultimate goal is not just to use R or K-means clustering, but to ensure these tools are always in service of a deeper understanding of the Learning Process.
Moving forward, we should expect to see more "Hybrid Researchers" who are as comfortable with a clustering algorithm as they are with a Vygotskian theoretical framework.