
Automated Image Analysis: Using SVM to Accelerate Microbial Growth Research
Computers and Electronics in Agriculture
This paper introduces an automated image analysis tool utilizing Support Vector Machines (SVM) to measure microbial growth area on solid culture media (Petri dishes). The method achieves high concordance with manual measurements (R² = 0.88) while significantly reducing processing time and manual effort.
TL;DR
Researchers have developed a fully automated tool using Support Vector Machines (SVM) to measure fungal growth on Petri dishes. By moving from manual estimation to pixel-level ML classification, they reduced image processing time by nearly 90% (from 5 minutes down to 32 seconds per image) while maintaining accuracy comparable to experienced human technicians (R² = 0.88).
The Bottleneck: Manual Measurement in the High-Throughput Era
In pathology and agricultural science, estimating microbial growth rate is essential for testing inhibitory compounds or virulence. However, the "gold standard" remains surprisingly primitive: technicians often measure colony radii with a ruler or manually segment images using software like ImageJ.
This approach suffers from three critical flaws:
- Geometric Bias: Assuming colonies are perfect circles leads to inaccurate area estimation for irregular growth patterns.
- Scalability: Processing hundreds of images manually is labor-intensive and expensive.
- Human Fatigue: Precision drops significantly as a technician processes large datasets due to stress and visual exhaustion.
Methodology: Pixel-Level Intelligence
The authors bypassed the need for complex deep learning architectures by leveraging the efficiency of Support Vector Machines (SVM).
1. Controlled Image Acquisition
To ensure the SVM could rely on color consistency, the team designed a custom "soft-box" with fixed lighting (3000 K LED) and camera settings (ISO 1600, f/5). This minimized stray light and shadows that could confuse the classifier.
2. SVM Classification Logic
Instead of complex shape-based detection, the model treats every pixel as a data point. Using the Red, Green, and Blue (RGB) channels as features, the SVM learns a hyperplane that separates the image into:
- Fungus (The target)
- Agar (The growth medium)
- Petri Dish Edge
- Background
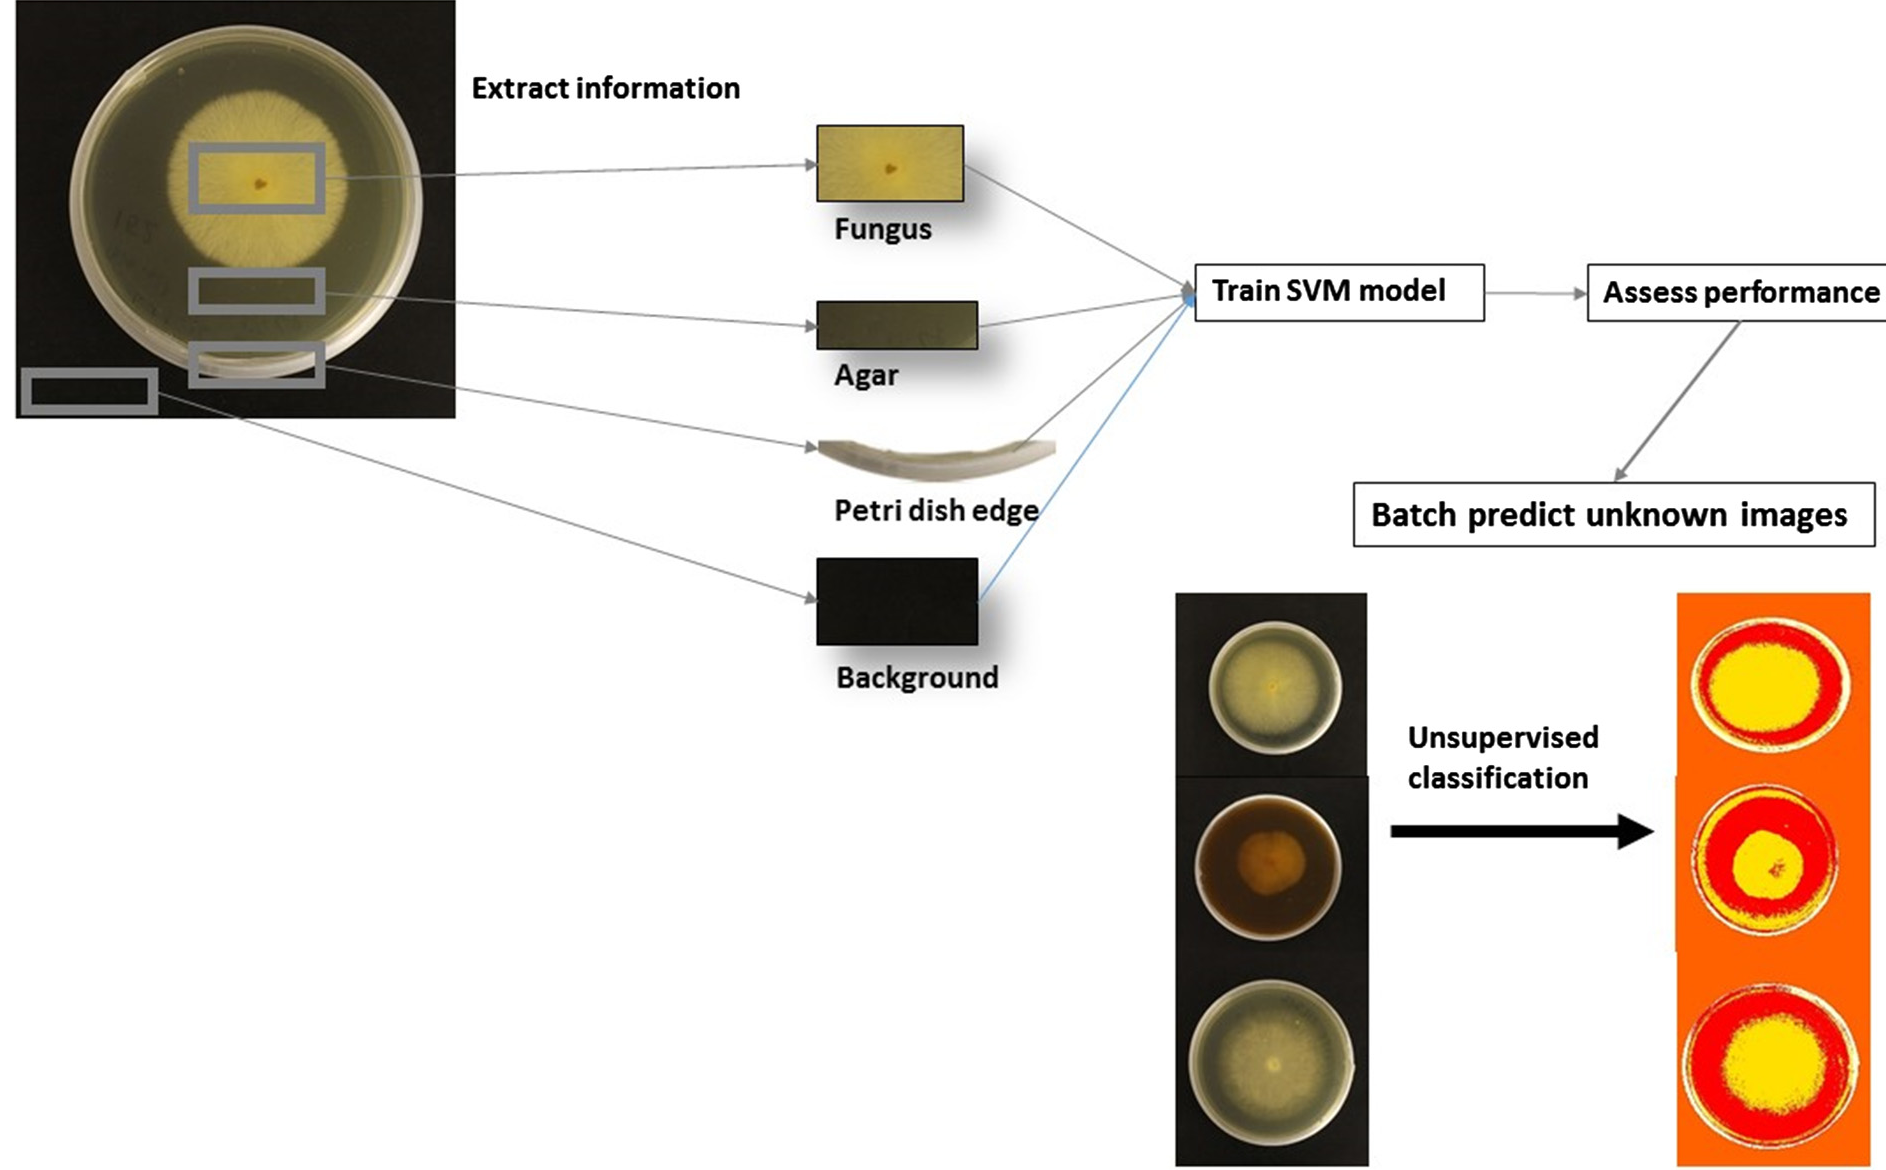 The workflow: from RGB extraction to pixel classification and final area calculation.
Experiments and Accuracy
The study tested the tool on three fungal species (C. puteana, G. trabeum, R. placenta) across five different agar media.
- High Precision: The model achieved a 94% per-pixel accuracy in calibration.
- Human-Level Performance: When compared against four experienced technicians, the SVM's mean error (1.92 cm²) was statistically similar to the range of error between the humans themselves (0.45 to 1.65 cm²).
- Robustness: Even when the fungus and agar had diffuse boundaries (making them hard to distinguish for the human eye), the SVM maintained high specificity.
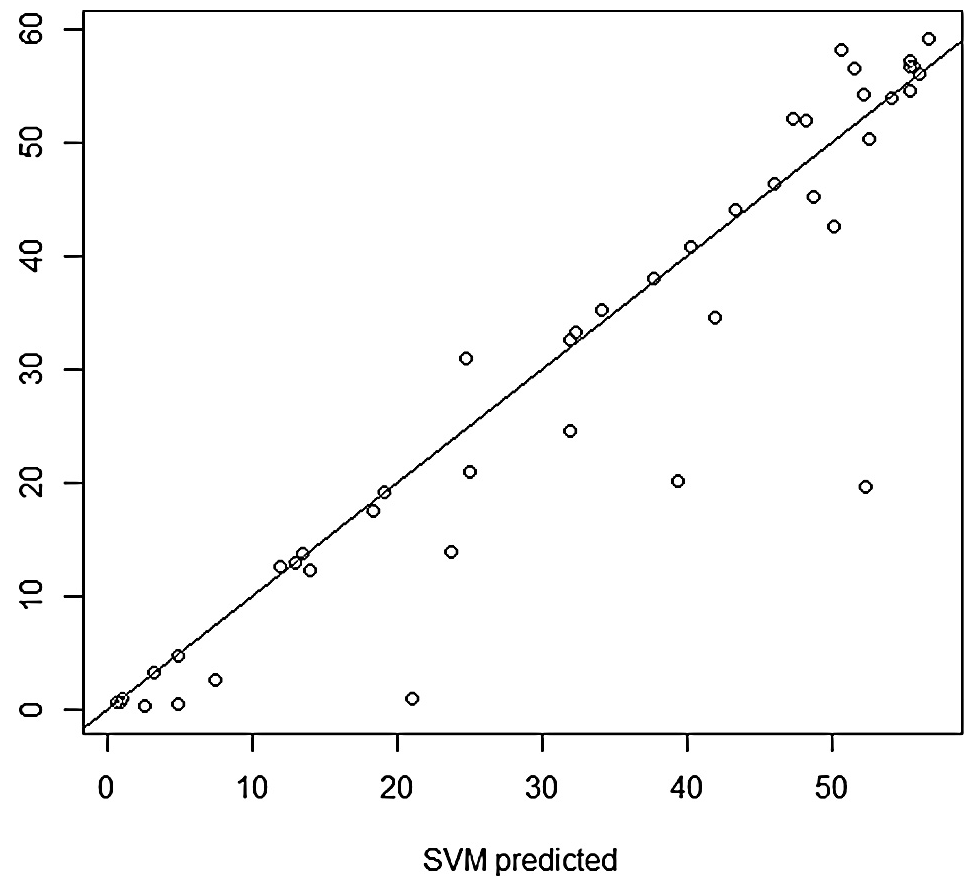 Concordance plot showing the manual vs. SVM measurements. The tight grouping indicates the automation is ready for production use.
Critical Insight: The Strength of "Simplicity"
While modern computer vision often jumps straight to neural networks, this paper demonstrates that SVMs are often superior for specific biological lab tasks. Since the environment (Petri dish, lighting) is controlled, a simpler model like SVM requires far less training data, processes images faster, and is more interpretable for biologists.
However, the authors note a crucial limitation: the model is highly sensitive to color temperature. A change in the LED bulb or a different species of fungus (e.g., green mold vs. white fungi) would require a quick "re-calibration" of the training samples.
Summary & Future Outlook
This work provides a blueprint for "Low-Code/Low-Compute" automation in biology. By reducing the time dedicated to rote measurement, researchers can focus on higher-level analysis, such as identifying the lag and exponential phases of growth curves.
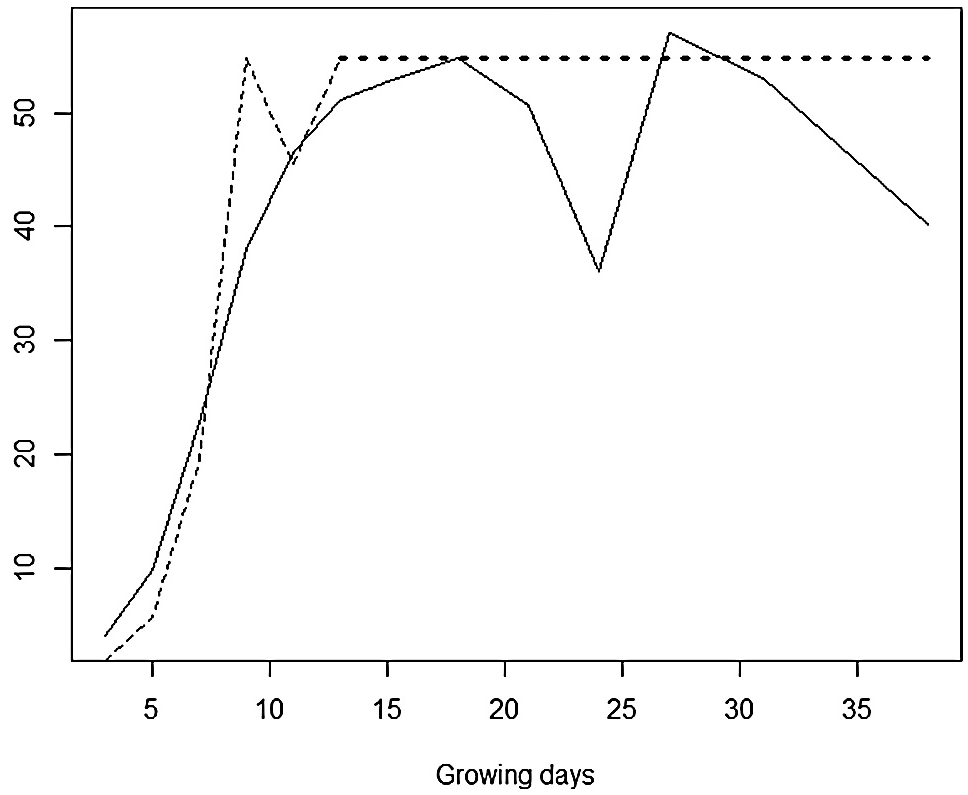 The tool allows researchers to generate precise growth kinetics over 20+ days with minimal manual intervention.
In the future, incorporating more advanced feature extraction (like texture analysis) could help the model distinguish between species with identical colors but different morphological patterns.