
Evolutionary Topology: Optimizing Sammon’s Projection via Differential Evolution
Computing Sammon's Projection of Social Networks by Differential Evolution
This paper explores the use of Differential Evolution (DE) to optimize Sammon’s Projection for visualizing high-dimensional social networks. By treating the projection as a real-parameter optimization problem, the authors demonstrate that DE significantly reduces projection error compared to traditional gradient-based heuristic methods.
TL;DR
Visualizing high-dimensional social networks often involves a trade-off between speed and structural accuracy. This paper introduces Differential Evolution (DE) as a replacement for traditional gradient-descent heuristics in Sammon’s Projection. By evolving a population of potential layouts, the authors achieved up to a 32% reduction in projection error, providing a more faithful 2D representation of complex co-authorship data.
Background: The Limits of Gradient Descent
In the realm of dimensionality reduction, Sammon’s Projection is a classic non-linear mapping designed to preserve the "global structure" of data by maintaining inter-point distances. However, the original algorithm proposed in 1969 relies on a pseudo-Newton minimization technique.
The Problem: Traditional solvers are notoriously sensitive to initialization and often stall at inflection points or local optima. In social network analysis—where distances represent weighted collaboration strengths—falling into a local minimum means the resulting map provides a distorted view of social proximity.
Methodology: Evolving the Perfect Layout
The authors pivot from calculus-based optimization to Differential Evolution (DE). DE is a stochastic, population-based optimizer that doesn't require gradient information, making it robust against the "bumpy" error surfaces (fitness landscapes) of Sammon's Stress.
The Optimization Pipeline:
- Representation: A candidate solution is an vector (where is the number of nodes and is the target dimension, e.g., 2).
- Mutation: New layouts are generated by taking the difference between random members of the population and adding them to a base vector: .
- Objective Function: The algorithm minimizes Sammon’s Stress (), which weights the squared differences between original and projected distances.
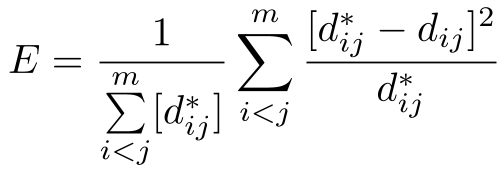 The Sammon’s Stress function: Note how it normalizes the error by the original distance, emphasizing the preservation of small distances (local structure).
Experimental Insights on Social Networks
The study utilized a real-world dataset from the DBLP co-authorship network, specifically focusing on the connections of researcher Vaclav Snasel.
Key Findings:
- Higher Accuracy: On the
g1250graph, DE outperformed the traditional heuristic by over 32%. - Visual Divergence: As seen in the generated plots, DE explores the search space differently, leading to layouts that might look less "traditional" than force-directed graphs but are mathematically more representative of the underlying data.
- The Cost of Precision: The primary drawback identified was computational overhead. DE averaged 25 seconds per projection, compared to less than a second for the heuristic method.
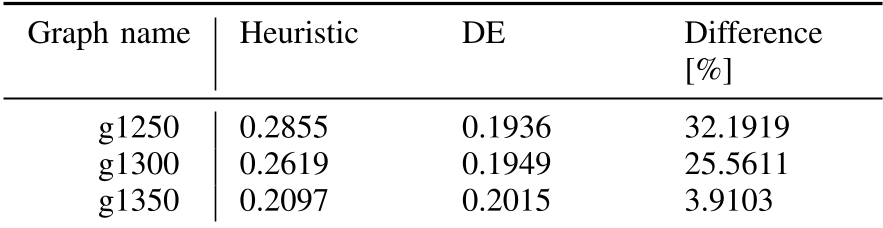 Table 1: Quantifying the superiority of DE in minimizing projection stress across different network snapshots.
Critical Analysis & Conclusion
This work highlights a critical choice for data scientists: Heuristic Speed vs. Metaheuristic Fidelity. While force-directed algorithms (like Fruchterman-Reingold) are excellent for aesthetic "hairball" reduction, they lack the mathematical rigor of a minimized Sammon’s Stress.
Limitations: The 30x increase in computation time suggests that vanilla DE may not scale well to networks with tens of thousands of nodes without parallelization or GPU acceleration.
Future Outlook: The integration of DE suggests that we can view "Graph Drawing" not just as a physics simulation (springs and forces), but as a high-dimensional optimization problem. Future research into Self-Adaptive DE or Hybrid CPU/GPU implementations could potentially bridge the speed gap, making high-fidelity evolutionary projections viable for large-scale data exploration.
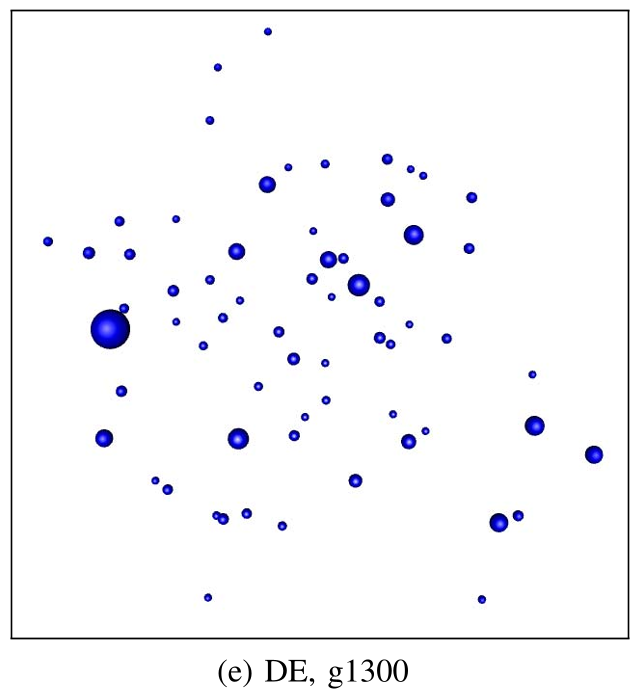 Comparison of network layouts: The alternative spatial distribution provided by DE (left/right) offers a different perspective on node clustering based on collaboration weight.