
Decoding the Human Component: A System Dynamics Approach to Socio-technical Reliability
A Conceptual Model of Human Behaviour in Socio-technical Systems
This paper introduces a conceptual model for assessing human behavior in socio-technical systems using System Dynamics (SD). By integrating Rasmussen's Skill-Rule-Knowledge (SRK) framework, the authors propose a Causal Loop Diagram (CLD) to quantify the dynamic interrelations of Performance Shaping Factors (PSFs) and their impact on Human Error Probability (HEP).
TL;DR
Human error accounts for 60-80% of industrial accidents, yet our methods for predicting it remain largely "static." This paper moves beyond simple checklists by applying System Dynamics (SD) to model the complex, circular relationships between stress, organizational culture, and cognitive performance. By using Causal Loop Diagrams (CLDs), the research provides a blueprint for understanding how small shifts in environmental factors can lead to catastrophic system failures.
The Evolution of Human Reliability Analysis (HRA)
To understand where this paper fits, we must look at the "generations" of HRA:
- 1st Gen (e.g., THERP): Treated humans like machines. You either flip the switch correctly or you don't.
- 2nd Gen (e.g., CREAM): Introduced context. It realized that an exhausted operator in a noisy room is more likely to fail.
- 3rd Gen (Dynamic): The current frontier. It recognizes that human performance is a moving target, influenced by feedback loops where errors change the risk level, which in turn changes operator stress and awareness.
Methodology: Mapping the Cognitive Loop
The heart of this research lies in marrying Rasmussen’s Skill-Rule-Knowledge (SRK) framework with System Dynamics.
1. The Cognitive Taxonomy
The authors categorize human actions into three levels of increasing complexity:
- Skill-based: Automatic, routine tasks (e.g., a driver connecting a hose).
- Rule-based: Following specific procedures (e.g., shutdown protocols).
- Knowledge-based: Problem-solving in unknown situations (e.g., reacting to an unprecedented pipe burst).
2. The Causal Loop Model
Instead of a linear path from "Stress" to "Error," the authors develop a CLD that shows how variables interact. For instance, a Human Error increases the Risk Level, which increases Risk Awareness, which might prompt better Organizational Factors, but also increases Stress.
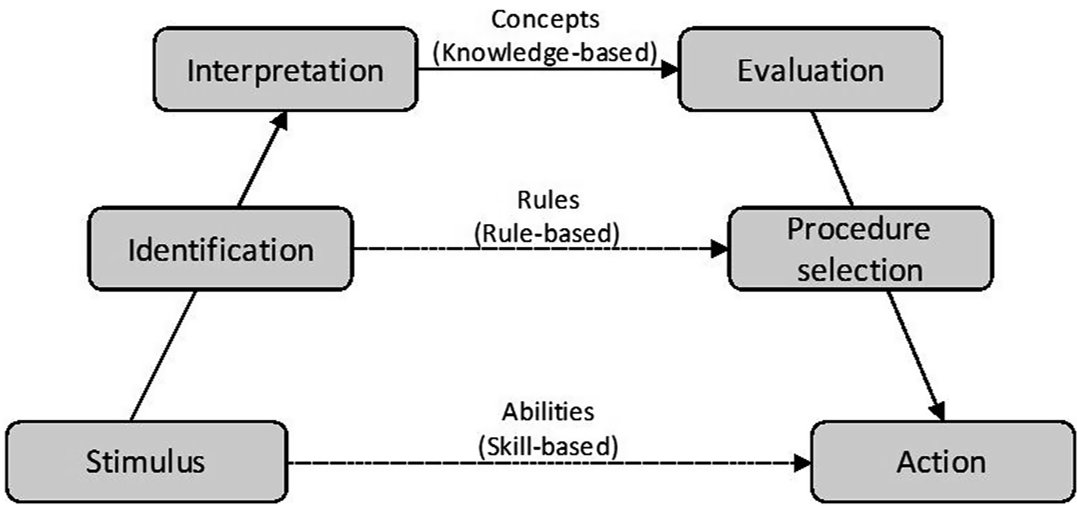 Figure 1: The hierarchical pathways of human cognition from signals to actions.
Deep Dive: The Causal Loop Diagram (CLD)
The proposed CLD (detailed in Figure 2 of the paper) visualizes how different factors feed into these cognitive levels.
- Organizational Factors (e.g., safety culture) primarily affect Rule-based activities.
- Individual Factors (e.g., experience) are the main drivers for Skill and Knowledge levels.
- Stress acts as a universal "degrader" across all loops.
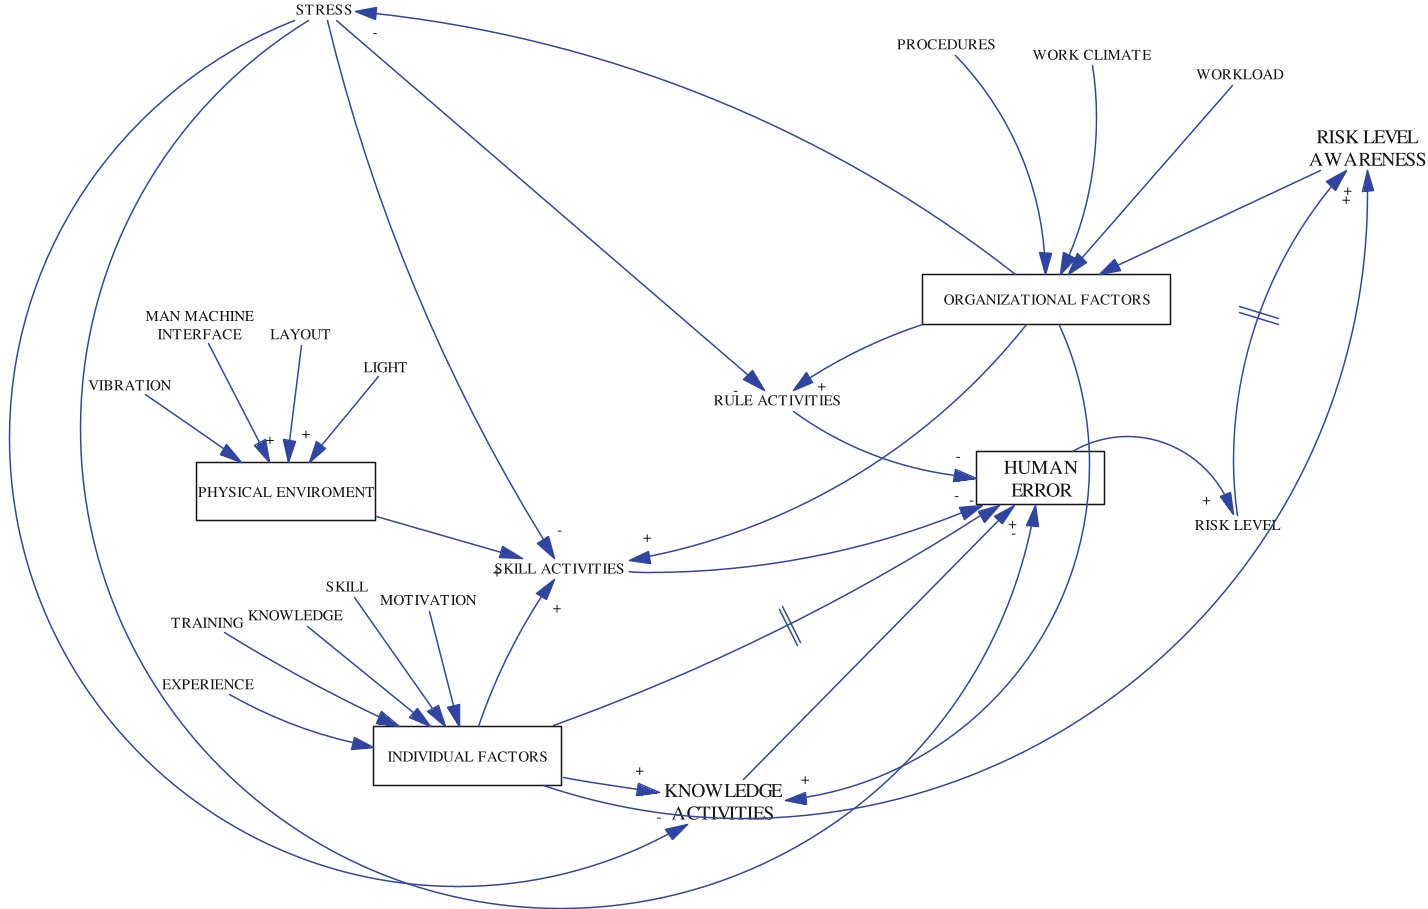 Figure 2: The interconnected variables influencing human performance within a socio-technical system.
Case Study: LPG Distribution Plant
To ground the theory, the authors analyzed an LPG (Liquid Petroleum Gas) plant.
- The Findings: In routine unloading (Skill-based), the "mnemonic" nature of the task was a high-risk point.
- The Feedback: They found that "Ergonomics" and "Layout" weren't just "nice-to-haves"—they were critical inputs to the Skill-based loop that prevented automatic slips during the connection of pipe connectors.
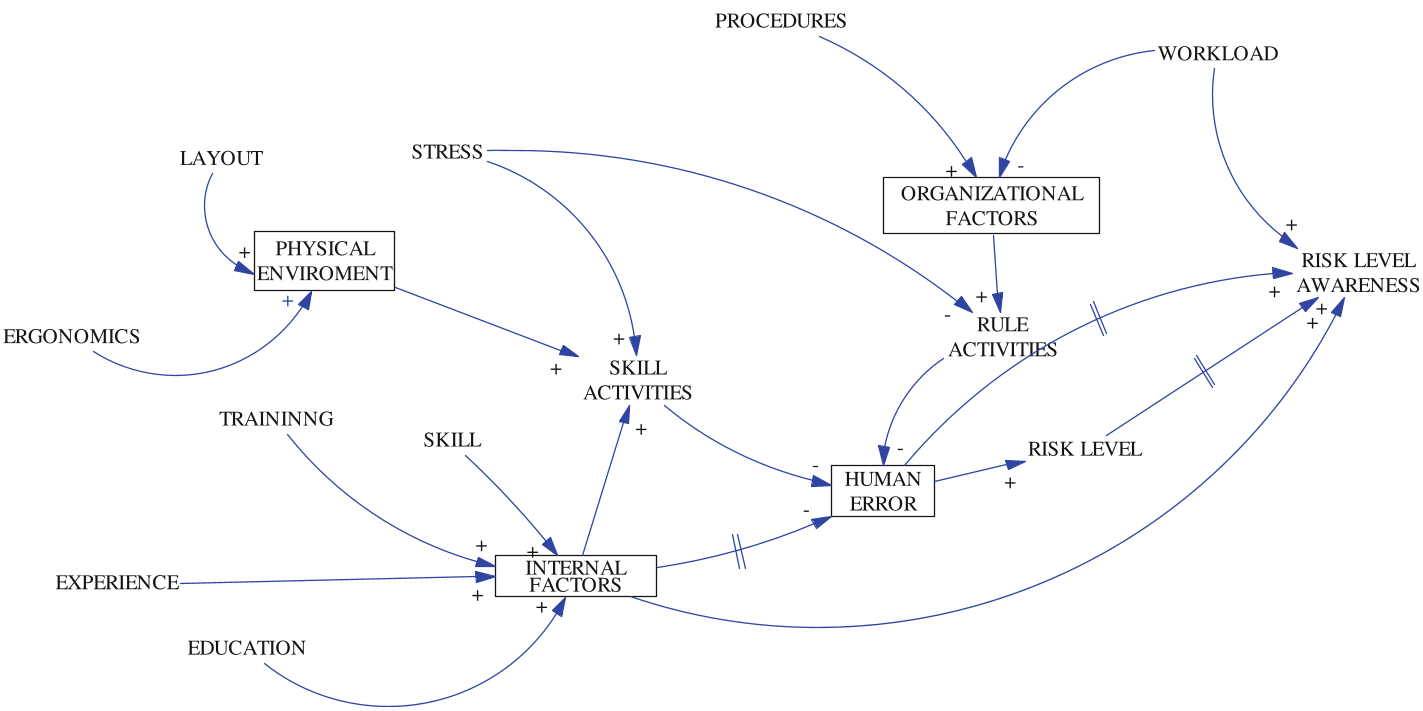 Figure 3: Context-specific CLD for the LPG distribution case study.
Critical Insight: Why System Dynamics?
The value-add of this work is the shift from Probabilistic Risk Assessment (PRA) to Systemic Modeling. While a Bayesian approach can tell you the probability of an error given certain conditions, System Dynamics allows managers to see the delay between a policy change (like increasing workload) and the eventual spike in error rates. It treats safety as an emergent property of the system rather than a lack of failures.
Conclusion & Future Outlook
This paper sets the stage for quantitative simulation. The next step for researchers is to transform these qualitative "arrows" into mathematical equations (Stock and Flow diagrams) that can simulate accident scenarios in real-time.
Key Takeaway for Industry: Don't just train your operators; optimize the feedback loops. If your safety procedures increase stress more than they increase awareness, your "safety system" might actually be driving the next human error.