
Measuring the Pulse of Social Change: A New Framework for Network Dynamicity
Conceptual Quantification of the Dynamicity of Longitudinal Social Networks
The paper introduces a novel conceptual framework and set of mathematical measures to quantify the dynamicity of longitudinal social networks. By comparing actor-level structural positions in short-interval networks (SINs) against an aggregated network, the authors provide a method to calculate the "Degree of Dynamicity" for individual actors (DDA) and entire network structures (DDN).
TL;DR
While we know social networks change over time, we rarely measure how much they change in a standardized way. This paper proposes a mathematical framework to quantify "Dynamicity"—the degree to which actors shift their roles and positions throughout a network's lifespan. By testing this on the infamous Enron email dataset, the authors demonstrate that these metrics can pinpoint organizational crises and individual "movers and shakers" with mathematical precision.
Problem & Motivation: Beyond "Flow" to "Intensity"
Most longitudinal research asks "How does the network evolve?" using tools like Stochastic Actor-Oriented Models (SAOMs). While powerful, these models often ignore the magnitude of the "shaking" within the network.
The authors argue that existing tools have three major gaps:
- Lack of Quantification: They describe the process but don't provide a single "score" for how dynamic a network is.
- Actor Granularity: It is difficult to identify which specific person is causing the most structural flux.
- Comparability: There is no easy way to compare the volatility of a 1,000-person corporation with a 30-person classroom.
Methodology: The "Static vs. Dynamic" Lens
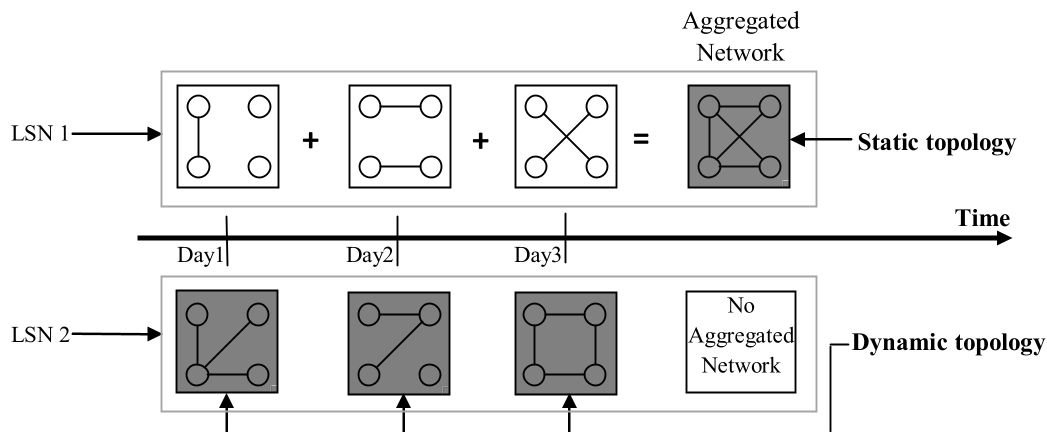
The core insight lies in the comparison between the Aggregated Network (the "Static" view of all interactions over time) and Short-Interval Networks (SINs) (the "Dynamic" snapshots).
The Dynamicity Formula
Dynamicity is defined as the average deviation of an actor's position in a snapshot from their total average position.
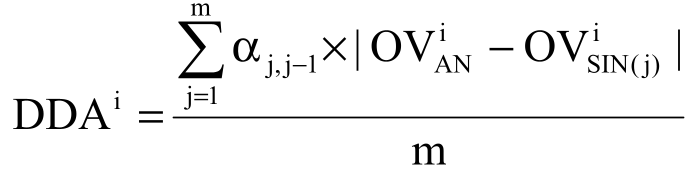
- (The Phase Transition Constant): This is the most critical innovation. It weights the result based on whether an actor was present or absent in the previous time step. If you suddenly join a network, your dynamicity score is adjusted to reflect that "entry" event.
- OV (Observed Value): This can be any SNA metric like Degree Centrality, Closeness, or Betweenness.
Topology Illustration
The researchers visualize this by comparing how methods are applied to the whole (static) vs. the slices (dynamic).
Experiments & Results: Enron vs. Students
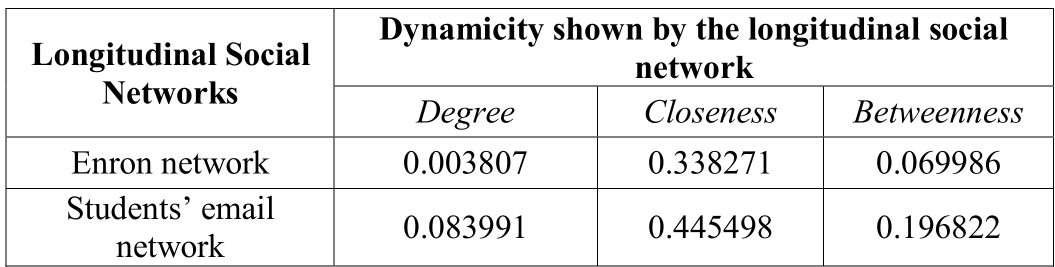
The authors applied these formulas to two distinct datasets: the Enron Email Corpus (2001) and a Student Communication Network.
Key Findings:
- Crisis Detection: In the Enron dataset, the SIN-level dynamicity scores (DDNSIN) spiked in October and November 2001. This perfectly aligns with the peak of the Enron financial scandal and subsequent bankruptcy.
- Contextual Volatility: The Student network showed much higher relative dynamicity than Enron. This suggests that in academic environments, communication patterns are more fluid and less hierarchical than in a corporate structure.
- Top Actor Overlap: The study found that individuals who are dynamic in terms of "Degree" (number of contacts) are often also dynamic in "Betweenness" (acting as bridges), suggesting that structural change is often driven by a few key "volatile" actors.
Critical Analysis & Conclusion
Takeaway
The ability to quantify dynamicity transforms longitudinal SNA from a purely descriptive social science into a more diagnostic technical field. We can now rank organizations by their "structural agility" or identify "unstable" actors before their shifting roles lead to systemic risk.
Limitations
The constant, while useful, is currently assigned somewhat arbitrary values (0, 0.5, 1.0). As the authors admit, these values might not accurately reflect "casual" members (like part-time employees) who appear absent but are actually just following a predictable schedule.
Future Outlook
This framework paves the way for real-time network monitoring. Imagine a system that alerts HR or Management when the "Dynamicity Score" of a team deviates from its baseline—serving as an early warning system for burnout, conflict, or organizational collapse.