
Conventional Data Mining vs. Financial Big Data: A Reality Check
Research of Conventional Data Mining Tools for Big Data Handling in Finance Institutions
This study evaluates the effectiveness of four conventional data mining tools—RapidMiner, Viscovery SOMine, XLMiner, and IBM SPSS—in handling "Big Data" within the financial sector. Using 270,000 banking transaction records, the paper benchmarks these tools based on data loading, cluster analysis, and visualization performance under standard hardware constraints.
Executive Summary
TL;DR: This paper investigates whether "everyday" data mining tools—the kind used by analysts in medium-sized banks—can actually handle the "Big Data" surge. By testing 270,000 customer transaction records against RapidMiner, Viscovery SOMine, XLMiner, and SPSS, the study reveals a sobering reality: most conventional tools buckle under pressure, either through data corruption, strict row limits, or massive "excluded case" errors.
Context: This work serves as a diagnostic benchmark for the financial services industry, highlighting the gap between available "accessible" software and the actual volume of modern digital banking.
The "Small-Bank" Big Data Dilemma
Following the 2008 financial crisis, risk management became data-intensive. While global tier-1 banks can afford custom-built Hadoop clusters and expensive specialized platforms, smaller institutions still rely on manual queries and GUI-based tools.
The authors identify a critical bottleneck: the "Digital Universe" is expanding exponentially, but the tools used by human analysts are often constrained by:
- Volume: The sheer number of rows in a transaction ledger.
- Variety: Data fragmented across SQL warehouses, SAP systems, and local spreadsheets.
- Flexibility: The need to perform complex tasks like clustering without needing a PhD in Data Engineering.
Methodology: The Benchmark Framework
The researchers subjected four popular tools to a "workload" test on a standard office PC (Core i3, 4GB RAM). The goal was to perform Cluster Analysis and Data Visualization on 270,000 records across 13 variables (Income, Balance, Customer Segments, etc.).
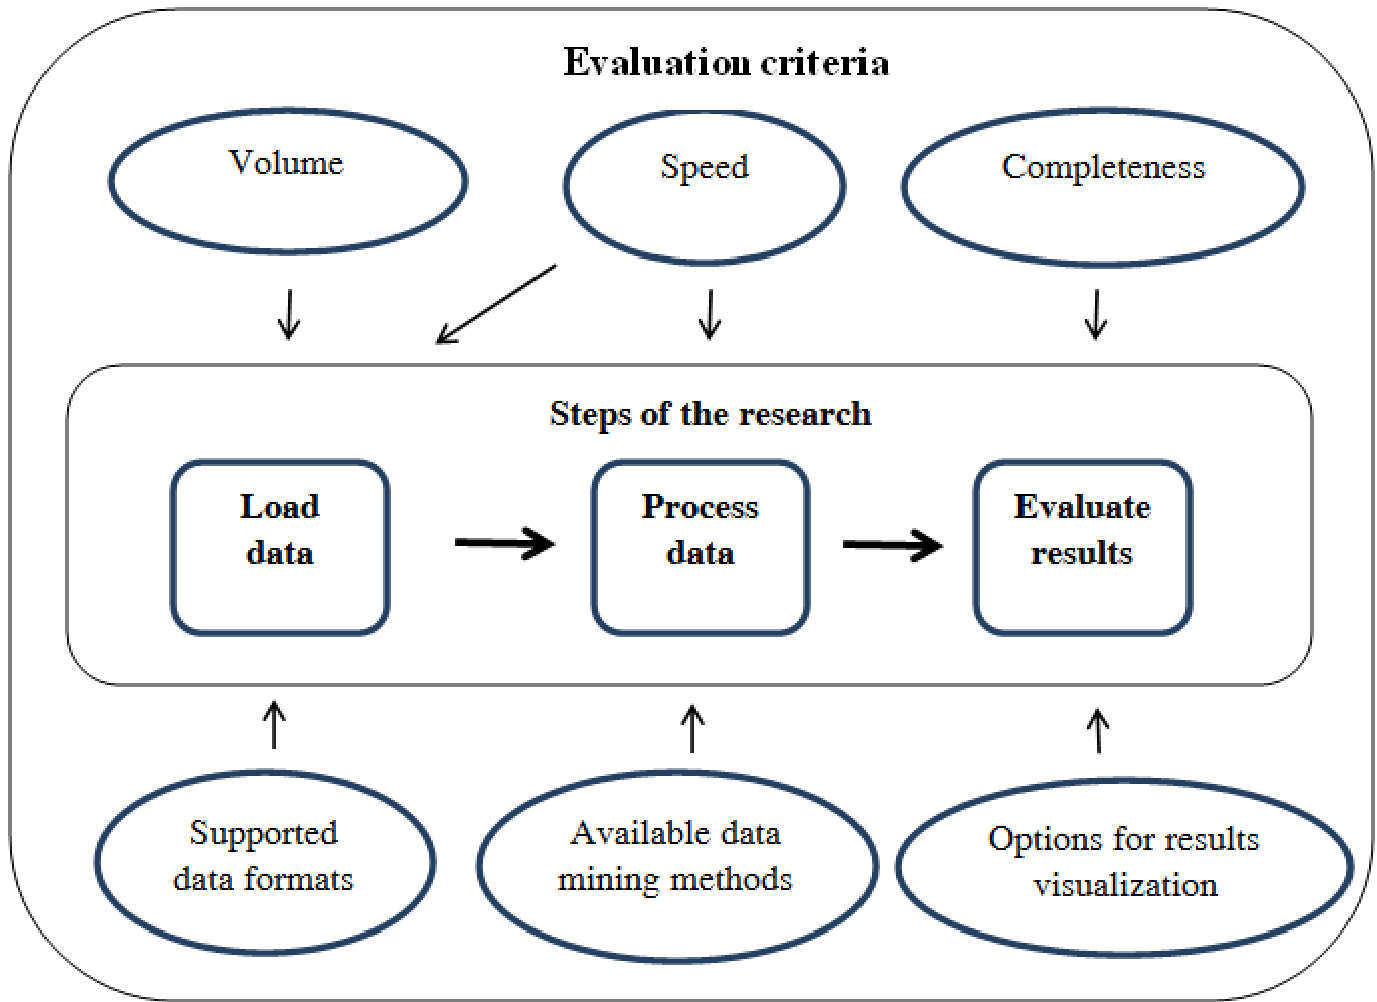 Figure 1: The four-step benchmarking process for software evaluation.
Software Performance Breakdown
1. RapidMiner: The Volume King
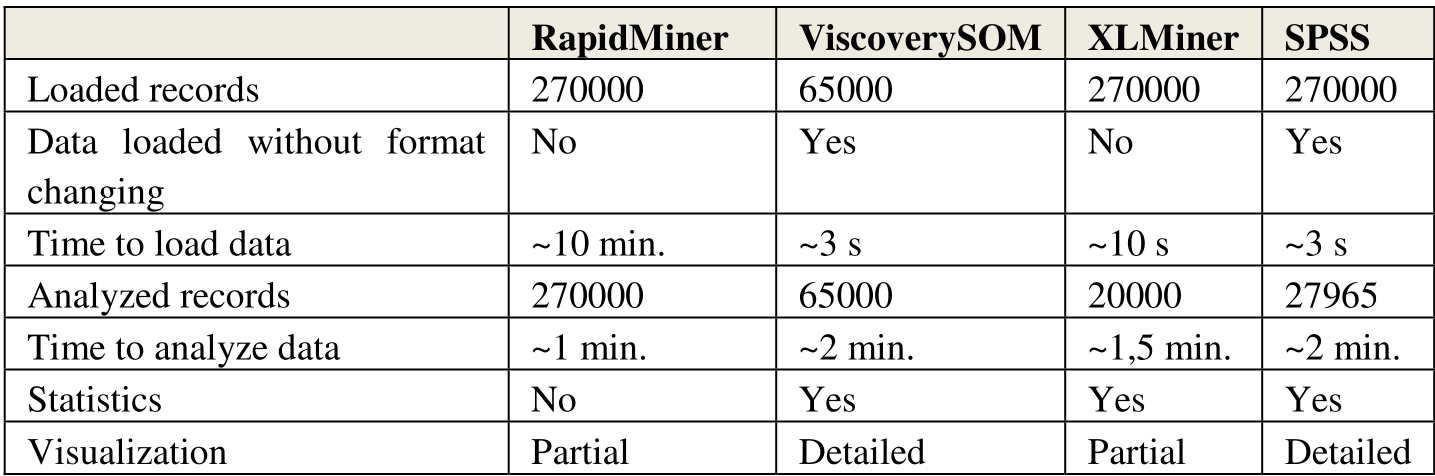
RapidMiner emerged as the most robust in terms of raw volume. While it failed to import Excel files due to the legacy 65,000-row limit of .xls, it successfully processed all 270,000 records once they were indexed in an Access database (.mdb).
- The Catch: While it performed K-Means clustering in under a minute, its "Self-Organizing Map" (SOM) visualization crashed after 10 hours of processing.
2. Viscovery SOMine: Visual Excellence, Scale Limited
This tool was praised for its intuitive visual interface, allowing analysts to see the "influence" of variables on specific clusters immediately.
- The Catch: It was strictly limited by format, capping the analysis at 65,000 records.
3. XLMiner: The Integrated Underperformer
As an Excel add-in, XLMiner is the most accessible. However, it proved the least capable of handling scale.
- The Catch: Even though the spreadsheet was loaded, the tool could only include 20,000 records in its clustering algorithm, rendering it useless for holistic bank-wide analysis.
4. IBM SPSS: The Corruption Crisis
Despite its prestige in statistics, the version tested (v17) struggled with data integrity.
- The Catch: A staggering 89.5% of cases were excluded during the clustering process, meaning the final "insight" was based on a non-representative fraction of the data.
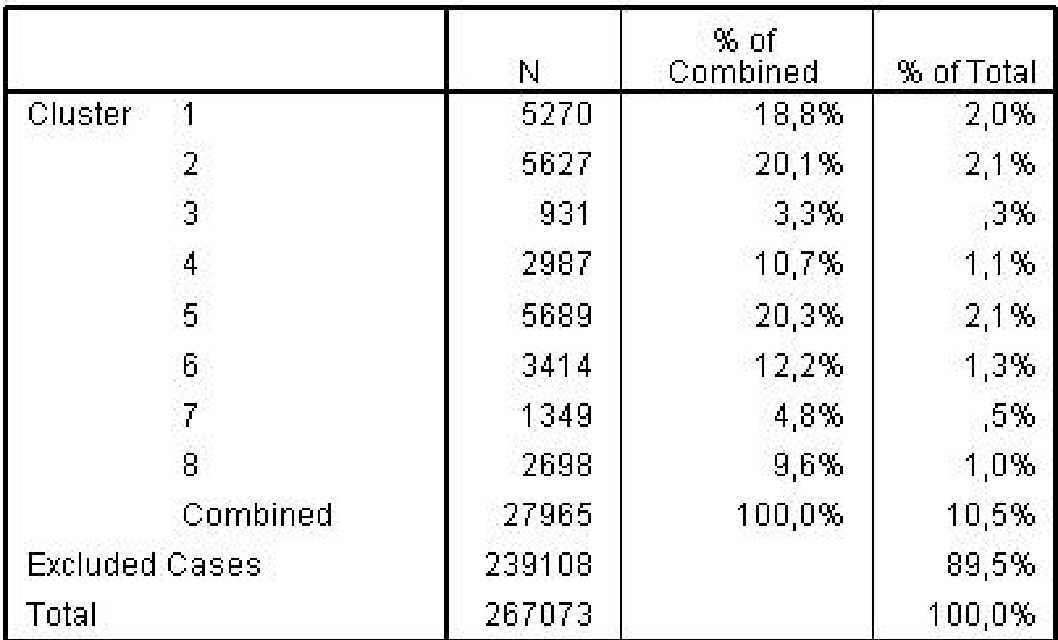 Figure 2: SPSS results showing the massive exclusion of data points.
Key Comparative Results
The following table summarizes the performance limits of the tested environments:
Critical Insight & Conclusion
The study proves that "capability" on paper does not equal "usability" in practice. Most conventional tools are built for "Wide Data" (many variables) but fail at "Long Data" (many transactions).
The Takeaway for Analysts:
- Stop using Excel as a Database: Standard spreadsheet formats create artificial ceilings for analytical tools.
- Pre-processing is Mandatory: Even "smart" tools like RapidMiner require data to be indexed in a relational database format (SQL/Access) before they can perform efficiently.
- Hardware is the Hidden Bottleneck: 4GB of RAM is insufficient for modern financial visualization; as the volume grows, the "Time to Insight" for visualization becomes the most expensive variable.
Future Outlook: The authors suggest that the only logical path forward for medium-sized financial institutions is the transition to cloud-based analytical systems, where compute power and RAM can scale dynamically with the transaction flow.