
Decoding the Wallet: How Social Ties and Economic Status Shape Our Spending
Correlations and dynamics of consumption patterns in social-economic networks
This study analyzes a unique coupled dataset of mobile phone communications and bank transactions from a Latin American country to map the "social-economic network." By defining socioeconomic status (SES) through Average Monthly Purchase (AMP), the authors uncover strong correlations between social structures and consumption patterns, achieving a detailed quantification of how purchasing habits are stratified across social classes.
TL;DR
By merging mobile phone records with bank transaction data for millions of users, researchers have mapped the "Social-Economic Network." The study reveals that your social circle and your economic class are not just predictors of your status—they are blueprints for your consumption habits. From the timing of purchases (Friday peaks for lower classes) to the types of services used (higher diversity for the wealthy), spending is a deeply stratified social behavior.
The Missing Link in Consumer Science
For decades, economists and sociologists have known that "who you know" and "what you earn" dictate your lifestyle. However, they lacked the data to prove it at a population scale. Previous work relied on self-reported surveys (often biased) or isolated datasets (social or financial). This paper bridges the gap by looking at 1 million people through a dual lens: their call logs (who they talk to) and their debit cards (what they buy).
Methodology: Mapping the Social-Economic DNA
The authors constructed two primary datasets:
- DS1 (The Intersect): Combined social ties and economic status of ~1 million overlapping users.
- DS2 (The Demographic Deep-Dive): 3.6 million users with age, gender, and highly granular Merchant Category Codes (MCC).
Estimating Wealth
Instead of relying on reported income, the authors used Average Monthly Purchase (AMP). This consumption-based proxy aligns remarkably well with the Pareto Law, yielding a Gini coefficient of 0.461—nearly identical to the official World Bank statistics for the region.
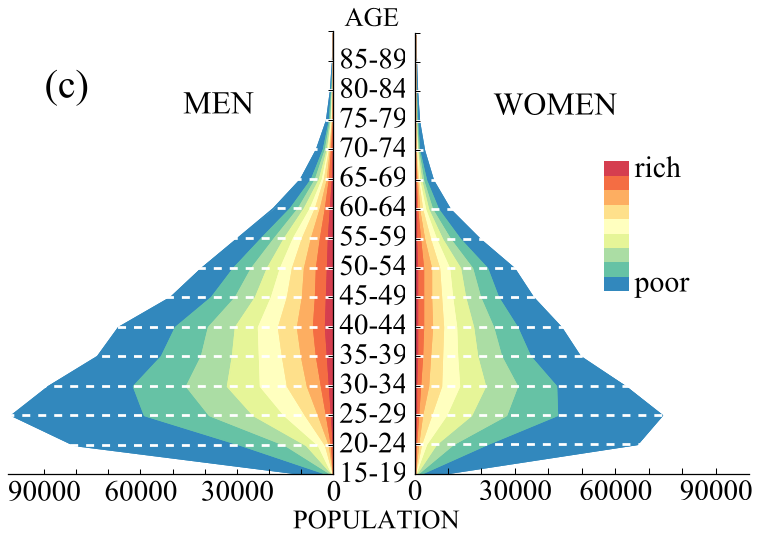 Figure 1: Distribution of Average Monthly Purchase and demographic pyramids across 9 identified socioeconomic classes.
Core Insights: Diversity vs. Concentration
A fascinating paradox emerged in the data:
- Spending Fluidity: Lower socioeconomic classes spend a massive portion of their budget on "Retail Stores" and "Gas Stations" (essentials).
- Entropy of Wealth: As individuals get richer, their Shannon Entropy increases. This means they distribute their wealth across more varied categories (Hotels, Professional Services, Jewelry), yet they become more similar to one another in their diverse patterns.
- The Friday Peak: Lower-income classes exhibit a sharp spending peak on Fridays (payday), whereas higher-income classes spread their spending more evenly throughout the week, even peaking on Saturdays for entertainment and dining.
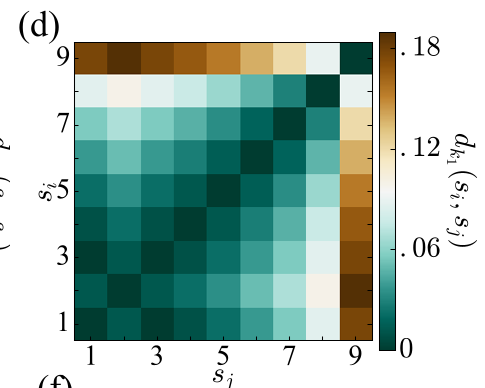 Figure 2: Differences in spending focus between the poorest (Class 1) and richest (Class 9) members of the society.
The Network Effect: Are Your Friends Your Financial Mirror?
Does talking to someone make you buy like them? The study used a Configuration Model to compare real social ties against a randomized version of the same network.
- Assortative Patterns: People connected by a social tie are significantly more likely to share purchasing habits, especially in "discretionary" categories like Education and Transportation (Airlines).
- Homophily: The diagonal component in the correlation matrices proves that people of similar SES connect with each other, and these connections amplify shared consumption behaviors.
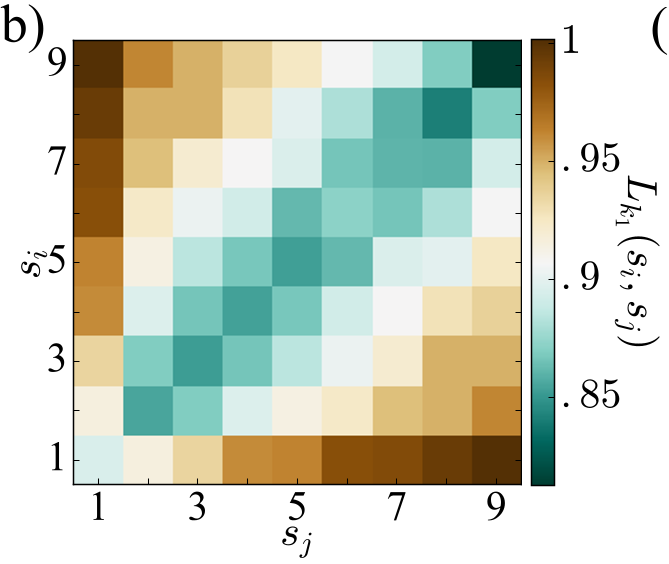 Figure 3: Matrix showing that connected individuals (especially within the same class) exhibit much higher similarity in spending than random pairs.
Deep Insight: The Merchant Category Network
By applying the Louvain Algorithm to 271 merchant categories, the authors found 17 distinct "spending communities." For example, "Personal Services" acts as a hub connecting many other consumption types. They also noted a strong Pearson correlation between Age and SES (0.42) and Gender and SES (0.29), indicating that in this specific landscape, older males tended to occupy higher socioeconomic tiers.
Conclusion & Real-World Impact
This research provides a mathematical foundation for what we’ve always suspected: our wallets are social.
- Marketing: Campaigns can be optimized by targeting "social hubs" within specific economic strata.
- Recommendation Systems: By incorporating a user's social circle's spending entropy, platforms can predict future purchases with higher precision.
- Resource Allocation: Governments can use transactional dynamics to understand the impact of payday cycles on local economies.
Takeaway: Our consumption is a mirror of our social embedding. We don't just spend based on what we need; we spend based on where we sit in the social-economic web.