
CVQS: Balancing User Satisfaction and Wallet Pressure in Mobile Video Streaming
10518_A Cost-Constrained Video Quality Satisfaction Study on Mobile Devices.
This paper introduces a novel Cost-constrained Video Quality Satisfaction (CVQS) model and framework for mobile streaming. It uniquely integrates technical parameters, content types, and psychological cost pressure from data usage to predict end-user Quality of Experience (QoE) and optimize DASH-based video delivery.
TL;DR
Higher bitrate doesn't always mean a happier user. This paper introduces the CVQS (Cost-constrained Video Quality Satisfaction) model, which proves that on mobile networks, user satisfaction peaks and then decays as data costs rise. By modeling this "cost pressure," the researchers achieved up to 56% bitrate savings while maintaining higher perceived satisfaction than traditional PSNR-based methods.
The "Cost Pressure" Blind Spot
In the world of academic QoE (Quality of Experience), we often chase the highest possible fidelity. Metrics like VMAF or SSIM tell us that more bits usually equal a better experience. However, in the real world—where 4G/5G data isn't always unlimited—users experience a psychological trade-off: "Is this 4K stream worth 2GB of my monthly data plan?"
Prior works focused on technical distortions or content types. This paper argues that Cost is a primary "prediction factor," and User Profiles (age, income, habits) are "moderation factors" that fundamentally change the satisfaction curve.
Methodology: The CVQS Model
The authors propose a systematic framework that treats Quality Satisfaction (QS) as a function of technical parameters (Bitrate, Resolution), Content Type (CT), and Cost (User Tolerance).
The Mathematical Intuition
The satisfaction curve is modeled in two opposing parts:
- The Quality Gain (4PL Function): As Bitrate (LBR) increases, clarity improves following a sigmoidal (S-shaped) curve.
- The Cost Decay (Exponential Function): As Bitrate increases, the associated data cost grows, creating a "downward pressure" on satisfaction.
The final CVQS equation integrates these: Where UAB (User's Expected Average Bitrate) represents the user's specific tolerance for data consumption.
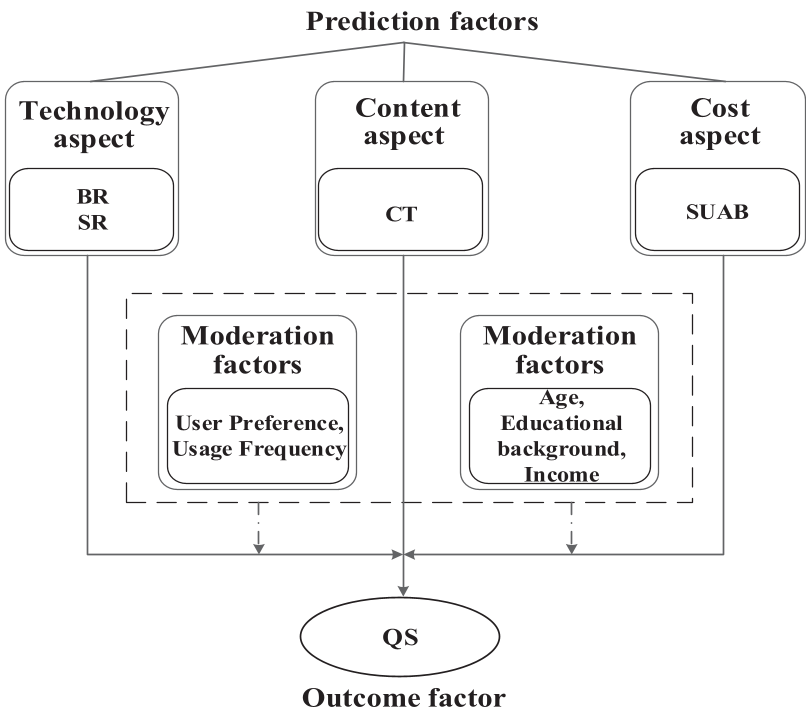 Figure 1: The Cost-Constrained QoE Interaction Framework depicting the interplay between technical, content, and cost factors.
Key Insights: Content and Demographics
The study revealed fascinating behavioral patterns:
- Content Sensitivity: Movies have the highest satisfaction potential, while sports require much higher bitrates to satisfy users due to fast motion, often leading to a "double-edged sword" where cost-pressure hits harder.
- The 480p "Sweet Spot": On mobile screens, the model found that 480p often yields higher satisfaction than 720p at certain bitrates because it delivers "good enough" clarity without the massive data penalty of HD.
- User Profiles: High-income and younger users are more "cost-resilient," whereas older users are significantly less willing to pay (in data) for incremental quality gains.
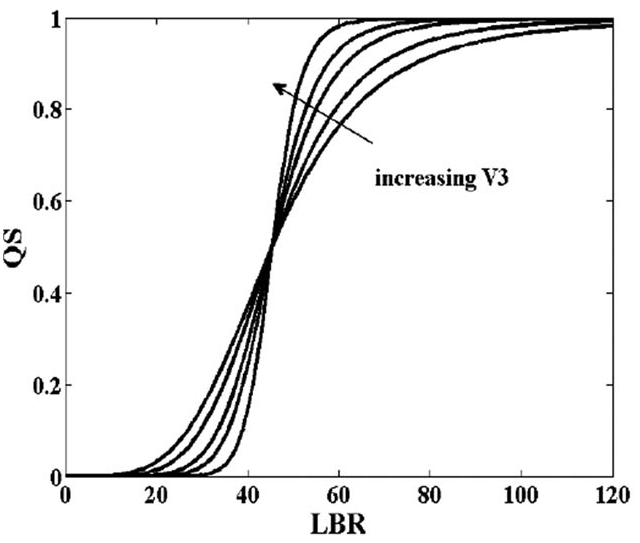 Figure 2: The satisfaction curve (Blue) peaks where the gain in clarity meets the rising pain of data cost.
Experimental Results: Real-world Impact
The researchers tested the CVQS model within a DASH (Dynamic Adaptive Streaming over HTTP) environment. By choosing the bitrate that maximized the CVQS score rather than the objective PSNR:
- Efficiency: They saved 56.2% of bitrate for News content compared to PSNR-based algorithms.
- Practicality: For a standard YouTube trailer, the model suggested a configuration that saved 71% of traffic (75MB vs 260MB) with minimal impact on perceived satisfaction.
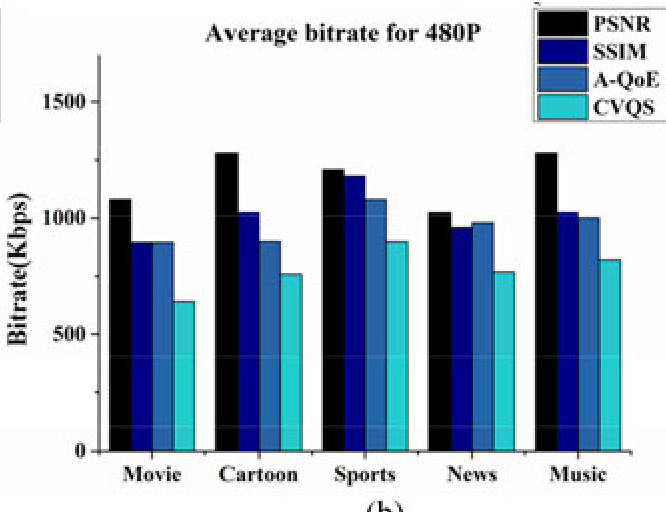 Figure 3: CVQS-based algorithms (Red/Pink) consistently maintain higher satisfaction scores across diverse content types compared to traditional SSIM/PSNR methods.
Critical Analysis & Conclusion
Takeaway
The CVQS model represents a shift from Service-oriented metrics to User-centric metrics. It proves that the "optimal" video quality is not a static technical target but a moving demographic target.
Limitations
- Dynamic Billing: The study mainly focused on "monthly bundle" billing. Satisfaction might drop even more sharply under "pay-per-MB" structures.
- Encoder Sensitivity: As the authors noted, the choice of encoder (e.g., switching from H.264 to AV1) would shift the quality-per-bitrate curve, requiring re-calibration of the model constants.
Future Outlook
This framework provides a blueprint for ISPs to offer "Data-Saver" modes that aren't just dumb throttles, but intelligent, content-aware optimization engines that maximize "Happiness per Megabyte."