
The Hidden Ripple Effect: How Customer Churn Erodes Social Neighborhood Value
The Influence of Customer Churn and Acquisition on Value Dynamics of Social Neighbourhoods
This paper investigates the social ripple effects of customer churn and acquisition in telecommunication social networks (TSN). By utilizing the Social Position (SP) measure and neighborhood value dynamics, the authors quantify how an individual's departure or arrival influences the communication activity of their direct social circle.
In the hyper-competitive telecommunications industry, losing a customer (churn) is usually measured by a single lost subscription fee. However, a groundbreaking study by Kazienko et al. reveals that the damage goes much deeper. Using Social Network Analysis (SNA), researchers have proven that when a customer leaves, they take a portion of their friends' and colleagues' engagement with them, creating a "value vacuum" in their social neighborhood.
TL;DR
This paper shifts the focus from Individual Value to Network Value. By analyzing real-world call data, the authors demonstrate that a churn event causes a significant drop (up to 23%) in the activity of the neighbors left behind. Moreover, a decline in a user's "Social Position" serves as a powerful leading indicator of intent to churn.
The Motivation: Why Individuals Are Not Islands
Traditional churn models are "ego-centric"—they look at a customer's billing history and usage patterns. The authors argue this is flawed because telecommunications are inherently social.
- The Insight: A phone call is a relationship anchor. If User A leaves the network, User B (their neighbor) no longer has a reason to make those specific calls.
- The Problem: Prior work underestimated the "social value" of a customer—the revenue they generate by inducing others to spend.
Methodology: Quantifying "Social Position"
The core of the study revolves around the Social Position (SP) measure. Unlike simple call counting, SP is an iterative algorithm that calculates a node's importance based on the importance of the people calling them.
The Core Formula
The mathematical backbone is defined as:
Here, represents the "openness" to social influence, and is the commitment or strength of the relationship. This is essentially a specialized version of PageRank tailored for social communication intensity.
Measuring the "Aftershock"
The researchers tracked the Social Value of the Neighbourhood (SVN)—the sum of the social values of all direct neighbors—before and after a churn event. Crucially, they excluded the churner's own activity to ensure they were measuring the influence on others, not just the loss of the churner themselves.
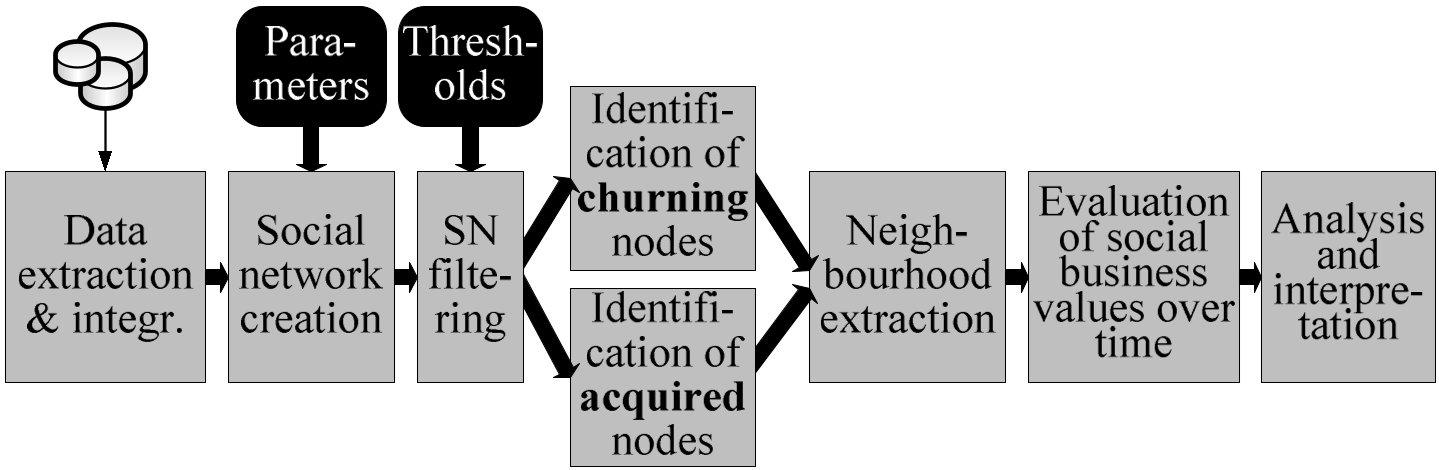 Figure 1: The workflow for identifying neighborhoods and measuring value dynamics during churn events.
Key Findings: The "Quiet" Departure
The experimental results from two massive datasets (Residential and Business) revealed two critical phenomena:
- Pre-Churn Fading: Churning customers don't just leave abruptly. Their Social Position is 40% to 57% lower than average members in the period before they leave. They effectively become "social ghosts" before the technical churn happens.
- Neighborhood Erosion: After a churner departs, their neighborhood's social position drops by 23% in residential sectors. This proves that churn is contagious—not necessarily that neighbors leave, but that they become significantly less active (and thus less profitable) subscribers.
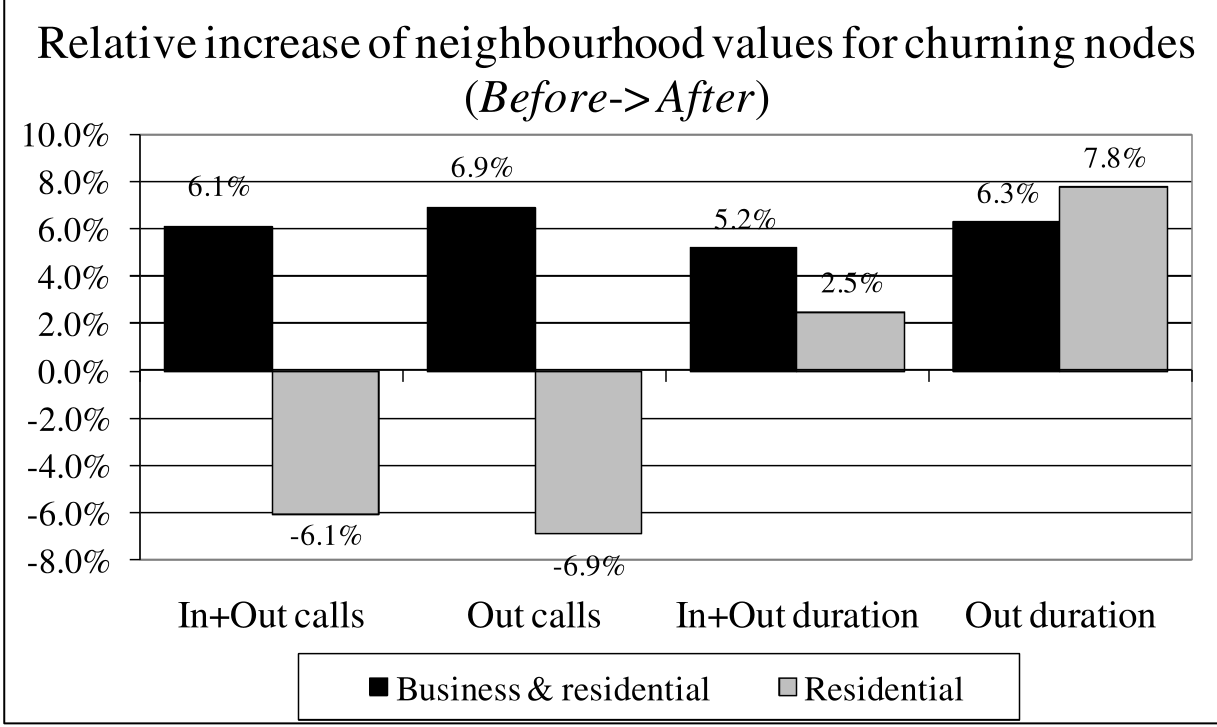 Figure 2: The marked decrease in neighborhood Social Position after a churn event compared to typical network fluctuations.
Critical Analysis & Business Impact
This research provides a "Social GPS" for retention teams. Instead of offering discounts to every customer who mentions leaving, companies should prioritize "Socially Heavy" nodes—those whose departure would cause the largest collapse in neighborhood activity.
Limitations:
- The study focuses on 10-day windows; long-term "equilibrium" changes might take months to manifest.
- The model assumes a direct link between call frequency and "social value," which may be complicated by modern data-heavy usage (WhatsApp, VoIP) that doesn't show up in traditional call logs.
Conclusion
Kazienko and his team have demonstrated that in a connected world, the "unit of value" is the Neighborhood, not the User. By monitoring the Social Position of individuals and the activity of their social circles, telecommunications providers can transition from reactive billing-based churn models to proactive, network-aware retention strategies.