
Decoding the 'Best Playmaker': Data-Driven Detection of Counterpressing in the Bundesliga
Data-driven detection of counterpressing in professional football A supervised machine learning task based on synchronized positional and event data with expert-based feature extraction
This paper presents a supervised machine learning approach to automatically detect "counterpressing" (Gegenpressing) in professional football using synchronized positional and event data. Utilizing an XGBoost model with expert-derived features, the system achieves an Area Under the Curve (AUC) of 87.4%, enabling large-scale tactical analysis across multiple Bundesliga seasons.
TL;DR
Researchers have developed a machine learning framework to automatically identify counterpressing—the high-intensity tactic of regaining the ball immediately after losing it. By analyzing synchronized tracking and event data with an XGBoost model, the study quantifies the risk-reward ratio of Jürgen Klopp’s famous Gegenpressing across 4,118 matches, providing a blueprint for automated, real-time tactical scouting.
The Problem with Subjectivity
In the elite echelons of professional football, "Counterpressing" (Gegenpressing) is often hailed as the ultimate tactical weapon. Coaches like Pep Guardiola and Jürgen Klopp have built dynasties on the "five-second rule." However, for performance analysts, quantifying this has been a nightmare.
Prior work relied on simple "rules of thumb"—such as a defender being within a five-yard radius of the ball. These methods are notoriously noisy, failing to differentiate between a team actively hunting the ball and a chaotic scramble where a player just happens to be nearby. The lack of an objective, automated metric means analysts spend hundreds of hours manually tagging video footage.
Methodology: Bridging Coaching Intuition and Machine Learning
The authors moved beyond simple distance metrics by extracting 134 hand-crafted features that capture the "physical intuition" of a tactical reset.
1. Tactical Feature Engineering
Instead of just ball coordinates, the model looks at:
- Local Compactness (Stretch Index): How tightly clustered are the five players closest to the ball?
- Defensive Reaction Time: How quickly does the team flip from an offensive shape to a pressing speed?
- Individual Ball Control: Distinguishing between uncontrolled "noise" (e.g., a deflected header) and a lost possession where a strategy could have been applied.
2. Model Architecture
The researchers utilized XGBoost, a scalable tree-boosting system. The model was trained on 11,108 labeled defensive turnovers across 97 professional matches.
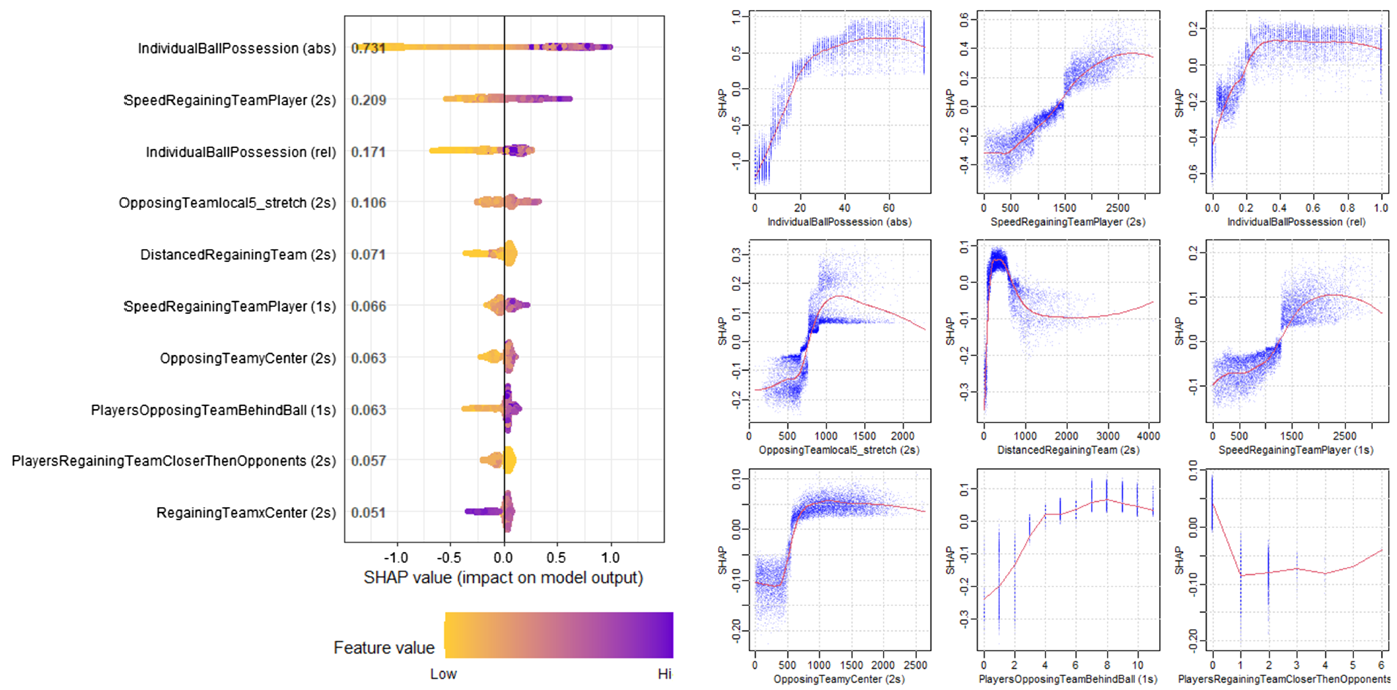 Figure 1: SHAP values revealing that individual ball possession and team speed 2 seconds post-turnover are the strongest predictors of counterpressing.
Insights from Six Seasons of Bundesliga
By applying the model to six seasons of German football, several "rules of thumb" were objectively validated for the first time:
- The Sideline Trap: Data confirms that counterpressing is significantly more successful when the ball loss occurs near the touchline (see Figure 3 in the paper), as the boundary acts as an extra defender.
- Numerical Superiority: Having more players within 10m of the ball at the moment of turnover increases the regain success rate from 30.2% to 36.2%.
- Risk vs. Reward: While successful counterpressing creates high-quality shots (6.27% of situations), a failed counterpress is a disaster—it leads to a shot against the pressing team 6.7% of the time, highlighting the "all-or-nothing" nature of the tactic.
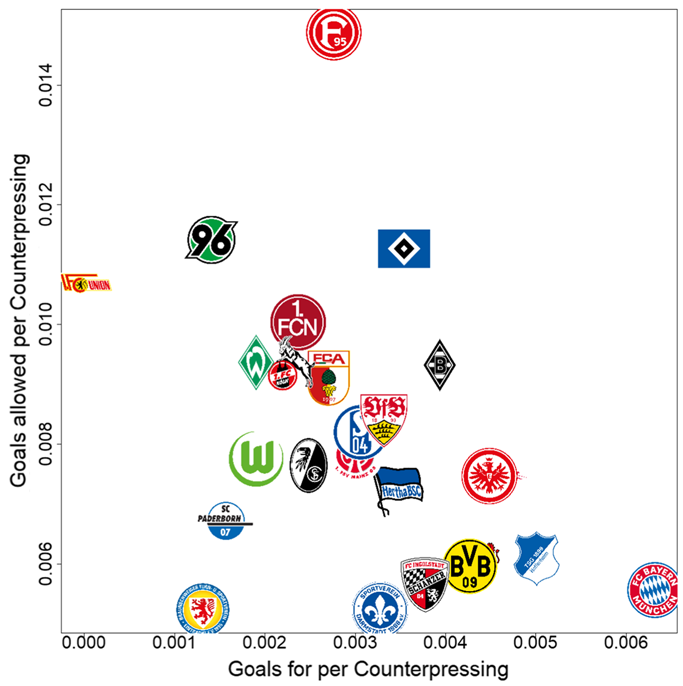 Figure 2: Offense vs. Defense Balance. Teams like FC Bayern and Dortmund under Tuchel show high efficiency, while riskier strategies lead to a higher volume of shots conceded.
Practical Application: Real-Time Tactical Reports
The study doesn't just rest on theory; it provides a proof-of-concept for the German National Team (DFB). By generating automated XML files compatible with video software like Hudl Sportscode, analysts can now skip the manual tagging and go straight to reviewing the "Calculated Tactical Transitions."
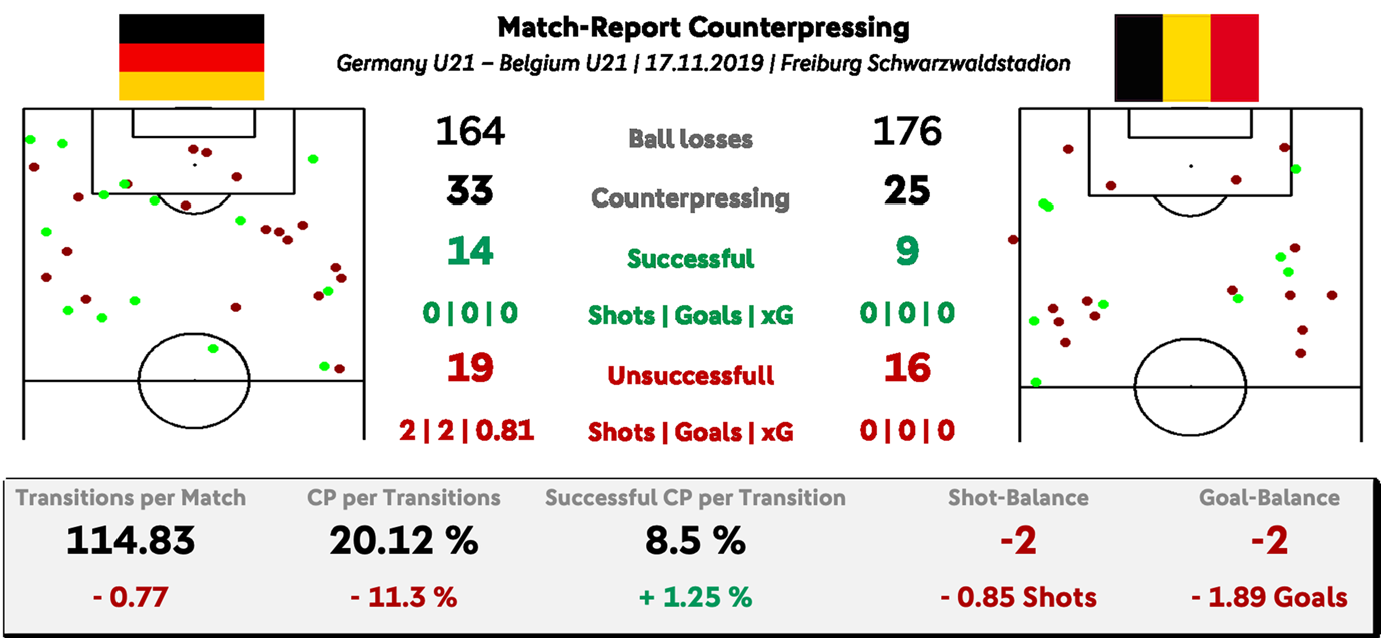 Figure 3: A sample automated match report from a Germany U21 fixture, benchmarking counterpressing KPIs against the Bundesliga average.
Critical Analysis & Takeaways
The brilliance of this work lies in its Inter-labeler reliability (82.01%). It acknowledges that even experts disagree on what constitutes a "press," but by using ML to find the consensus, it creates a standardized baseline.
Limitations: The model is currently focused on the existence of the strategy. Future work needs to integrate Expected Possession Value (EPV) to determine not just if a team pressed, but if pressing was the optimal decision compared to falling back into a defensive block.
Conclusion: This paper pushes sports analytics from "What happened?" (event data) to "Why did it happen?" (tactical intent). For the modern coach, these automated KPIs are no longer a luxury—they are the new standard for competitive advantage.