
Unlocking Earth’s Secrets: Data Mining at Scale for Environmental Science
Development of a data mining application for huge scale earth environmental data archives
The paper presents a specialized data mining and analysis system designed for massive Earth environmental datasets (e.g., satellite and meteorological archives). It features a high-performance backend integrated with a user-friendly Web-GUI and a "Huge Display Wall" for high-resolution visualization, enabling non-computational researchers to extract complex spatio-temporal correlations.
TL;DR
As the volume of Earth observation data grows into the petabyte scale, traditional analysis tools have become bottlenecks. This paper introduces a specialized data mining system that allows climate researchers to perform complex Time-Lag Correlation analysis through a web interface. By applying this system to 22 years of global data, the authors identified previously unknown mechanisms behind the start of the Indian Monsoon.
Background: Data is Growing, but Analysis is Stalling
Recent advances in satellite technology and climate simulations have created a data deluge. Projects like the Coordinated Enhanced Observing Period (CEOP) generate nearly 150 terabytes of data annually.
However, a significant gap exists:
- Volume vs. Capability: Researchers can only process a fraction of the data they collect.
- Resolution Loss: To fit data into standard software, researchers often "downsample," losing critical fine-grained details.
- The Technical Barrier: Leading climate scientists are experts in physics, not necessarily in distributed systems or high-order database management.
Methodology: The Architecture for Massive Spatio-Temporal Data
The authors built a robust system structure designed to bridge the gap between heavy-duty storage and the researcher's desktop.
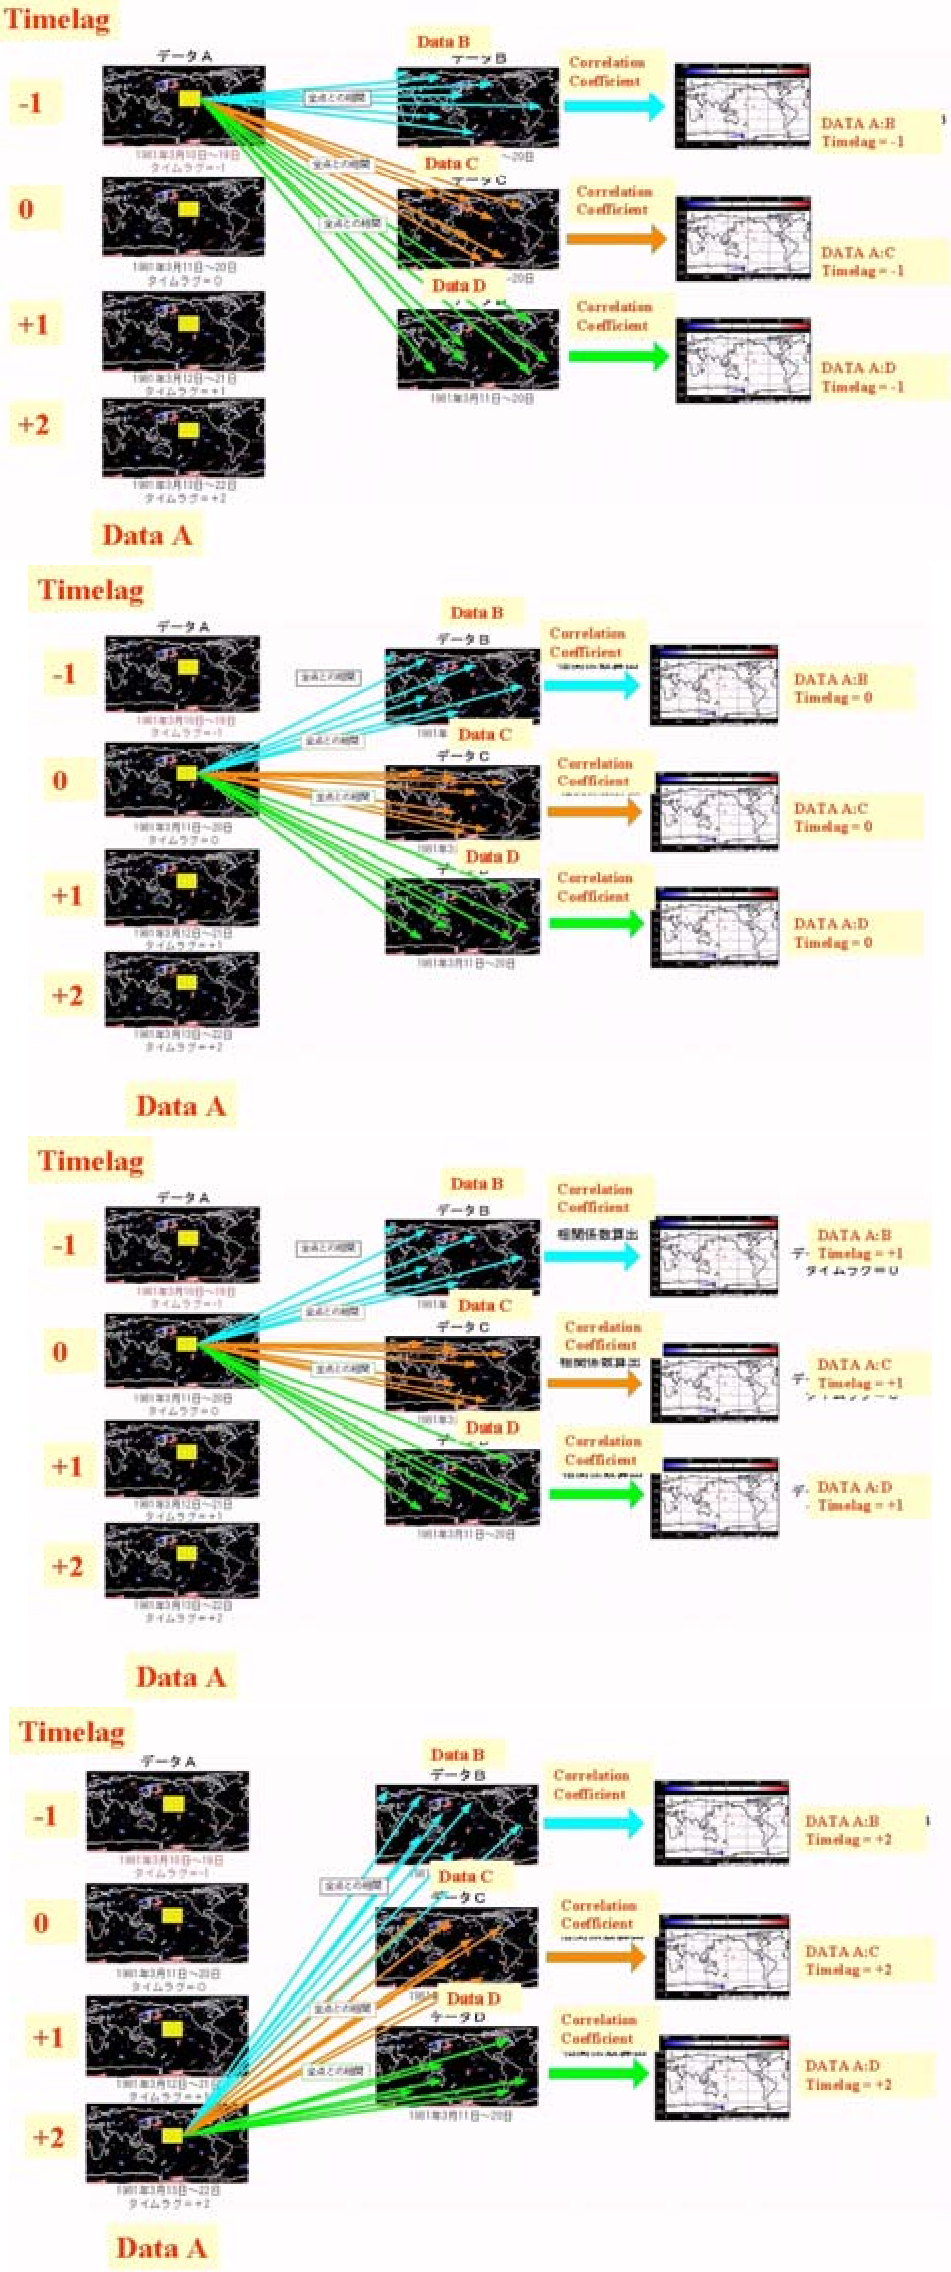 Fig. 1: The overarching architecture connecting Web Servers, Data Mining engines, and 0.5PB Archives.
The "Secret Sauce": Time-Lag Correlation
Physical events in nature rarely happen simultaneously. A temperature change in the Indian Ocean might influence rainfall in the Indian subcontinent three days later. The system implements a flexible calculation engine that:
- Defines a Base Area and time sequence.
- Scans Target Data across various spatial and temporal offsets.
- Computes correlation coefficients to map how phenomena move and change over time.
Visualizing the Invisible
A highlight of the work is the Huge Display Wall (a 15-screen 50-inch matrix). While web interfaces provide accessibility, the display wall allows for a "birds-eye view" of global patterns without sacrificing the 1-degree resolution of the original datasets.
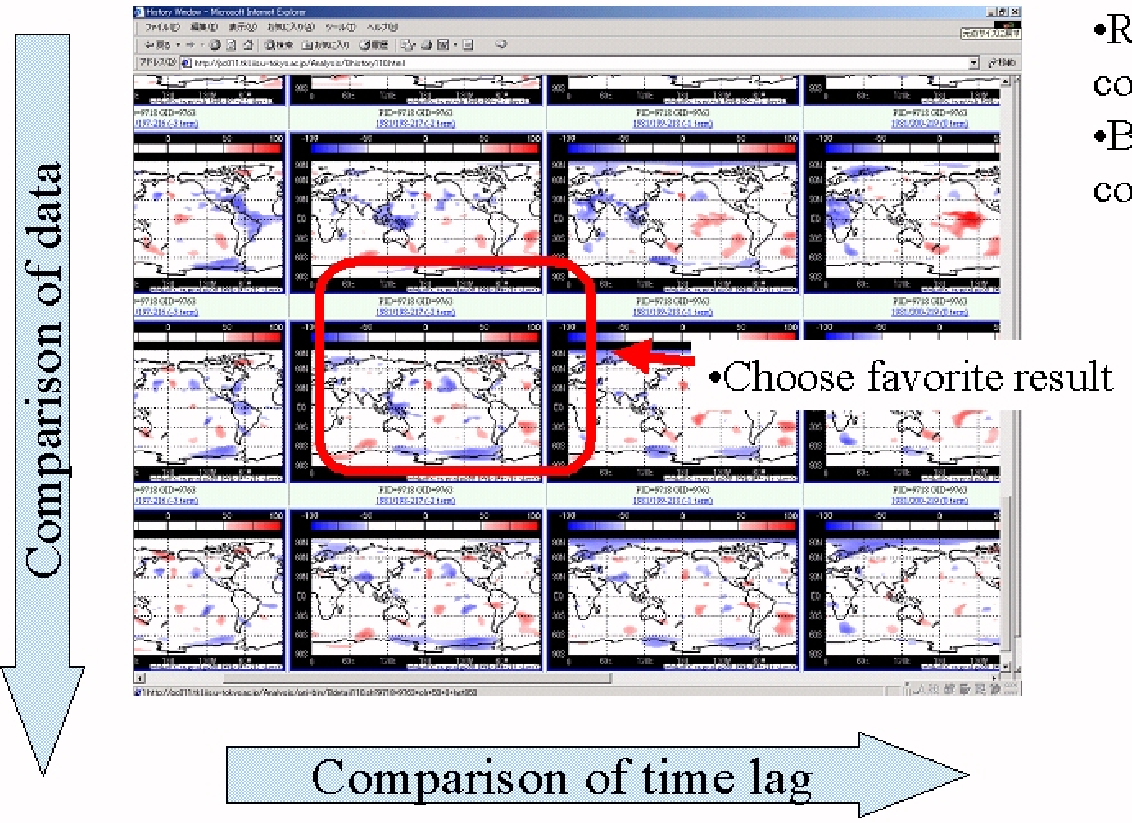 Fig. 2: Visual mapping of positive (red) and negative (blue) correlations across the globe with various time lags.
Science Case Study: The Indian Monsoon Onset
The system was put to the test analyzing the Indian Monsoon, a phenomenon critical to the economy and survival of billions. By analyzing 22 years of daily average data (GPCP, OLR, NCEP/NCAR), the researchers discovered:
- The Cyclone Factor: In 9 out of 22 years, monsoons were "jump-started" by cyclones, regardless of temperature gradients.
- The Thermal Inclination Factor: In non-cyclone years, the monsoon begins only when a specific temperature gradient is reached between the heated Arabian Peninsula and the cooler Arabian Sea.
This discovery provides a clear roadmap for meteorologists: if no cyclone is present, monitoring the temperature gradient enables highly accurate onset prediction.
Critical Insight & Conclusion
This work demonstrates that the future of Earth Sciences isn't just about more sensors, but about intermediate middleware—systems that can digest raw archival data and present it in a format where human intuition can take over.
Takeaway: High-performance data mining removes the "technical tax" paid by researchers, allowing them to focus on the "Why" and "How" of climate change rather than the plumbing of "How to open a 90TB file."
Limitations: The system, while powerful for its time (2004/2006 era), uses RDBMS (PostgreSQL) which might struggle with the even larger, unstructured multi-modal data used in modern 2026 climate AI models. However, its focus on Time-Lag Correlation remains a fundamental pillar of climate informatics.