
Data-Driven Sartorial Precision: Improving Industrial Standards via Two-Stage Clustering
Data mining to improve industrial standards and enhance production and marketing: An empirical study in apparel industry
This paper proposes an integrated data mining framework utilizing a two-stage cluster analysis (Ward’s method and K-means) to develop standardized size charts for the apparel industry. Applied to an empirical study of adult Taiwanese females, the method successfully classified body types into five distinct categories, achieving a 95.08% population coverage rate.
TL;DR
The global apparel industry faces a multi-billion dollar problem: poor fit leads to wasted materials and lost sales. This research introduces a data mining framework that replaces traditional "guesswork" sizing with a mathematically rigorous two-stage cluster analysis. By analyzing anthropometric data from nearly 1,000 subjects, the authors developed a sizing system that covers over 95% of the population with 93 optimized size groups, significantly reducing the gap between mass production and individual body reality.
Problem & Motivation: The "Fit" Crisis in Knowledge Economy
In the era of modern manufacturing, standard size charts are the "GPS" of production. However, most existing standards are archaic, based on data from the late 18th century or mid-20th-century military samples.
The author identifies three critical pain points:
- Inefficient Inventory: Over-production of sizes that don't fit the actual population leads to massive inventory costs.
- Consumer Frustration: "Trial and error" shopping leads to time loss and high return rates.
- Static Standards: Humans change (nutrition, lifestyle), but size charts often remain static for decades.
The research insight is clear: instead of forcing people into boxes, we must use Cluster Analysis to let the data define the boxes.
Methodology: The Two-Stage Mathematical Framework
The core of the paper is a four-step pipeline that transitions from raw measurements to industrial rules.
1. Feature Engineering (Factor Analysis)
Before clustering, the researchers reduced 52 anthropometric variables down to 16 key dimensions. Through factor analysis, they identified two primary latent variables:
- Factor 1 (Girth Factor): Waist, hip, and thigh measurements.
- Factor 2 (Height Factor): Hip height, knee height, and leg length.
2. The Two-Stage Clustering Engine
The methodology avoids the pitfalls of single-algorithm approaches by combining Ward's Minimum Variance (Hierarchical) and K-means (Non-hierarchical).
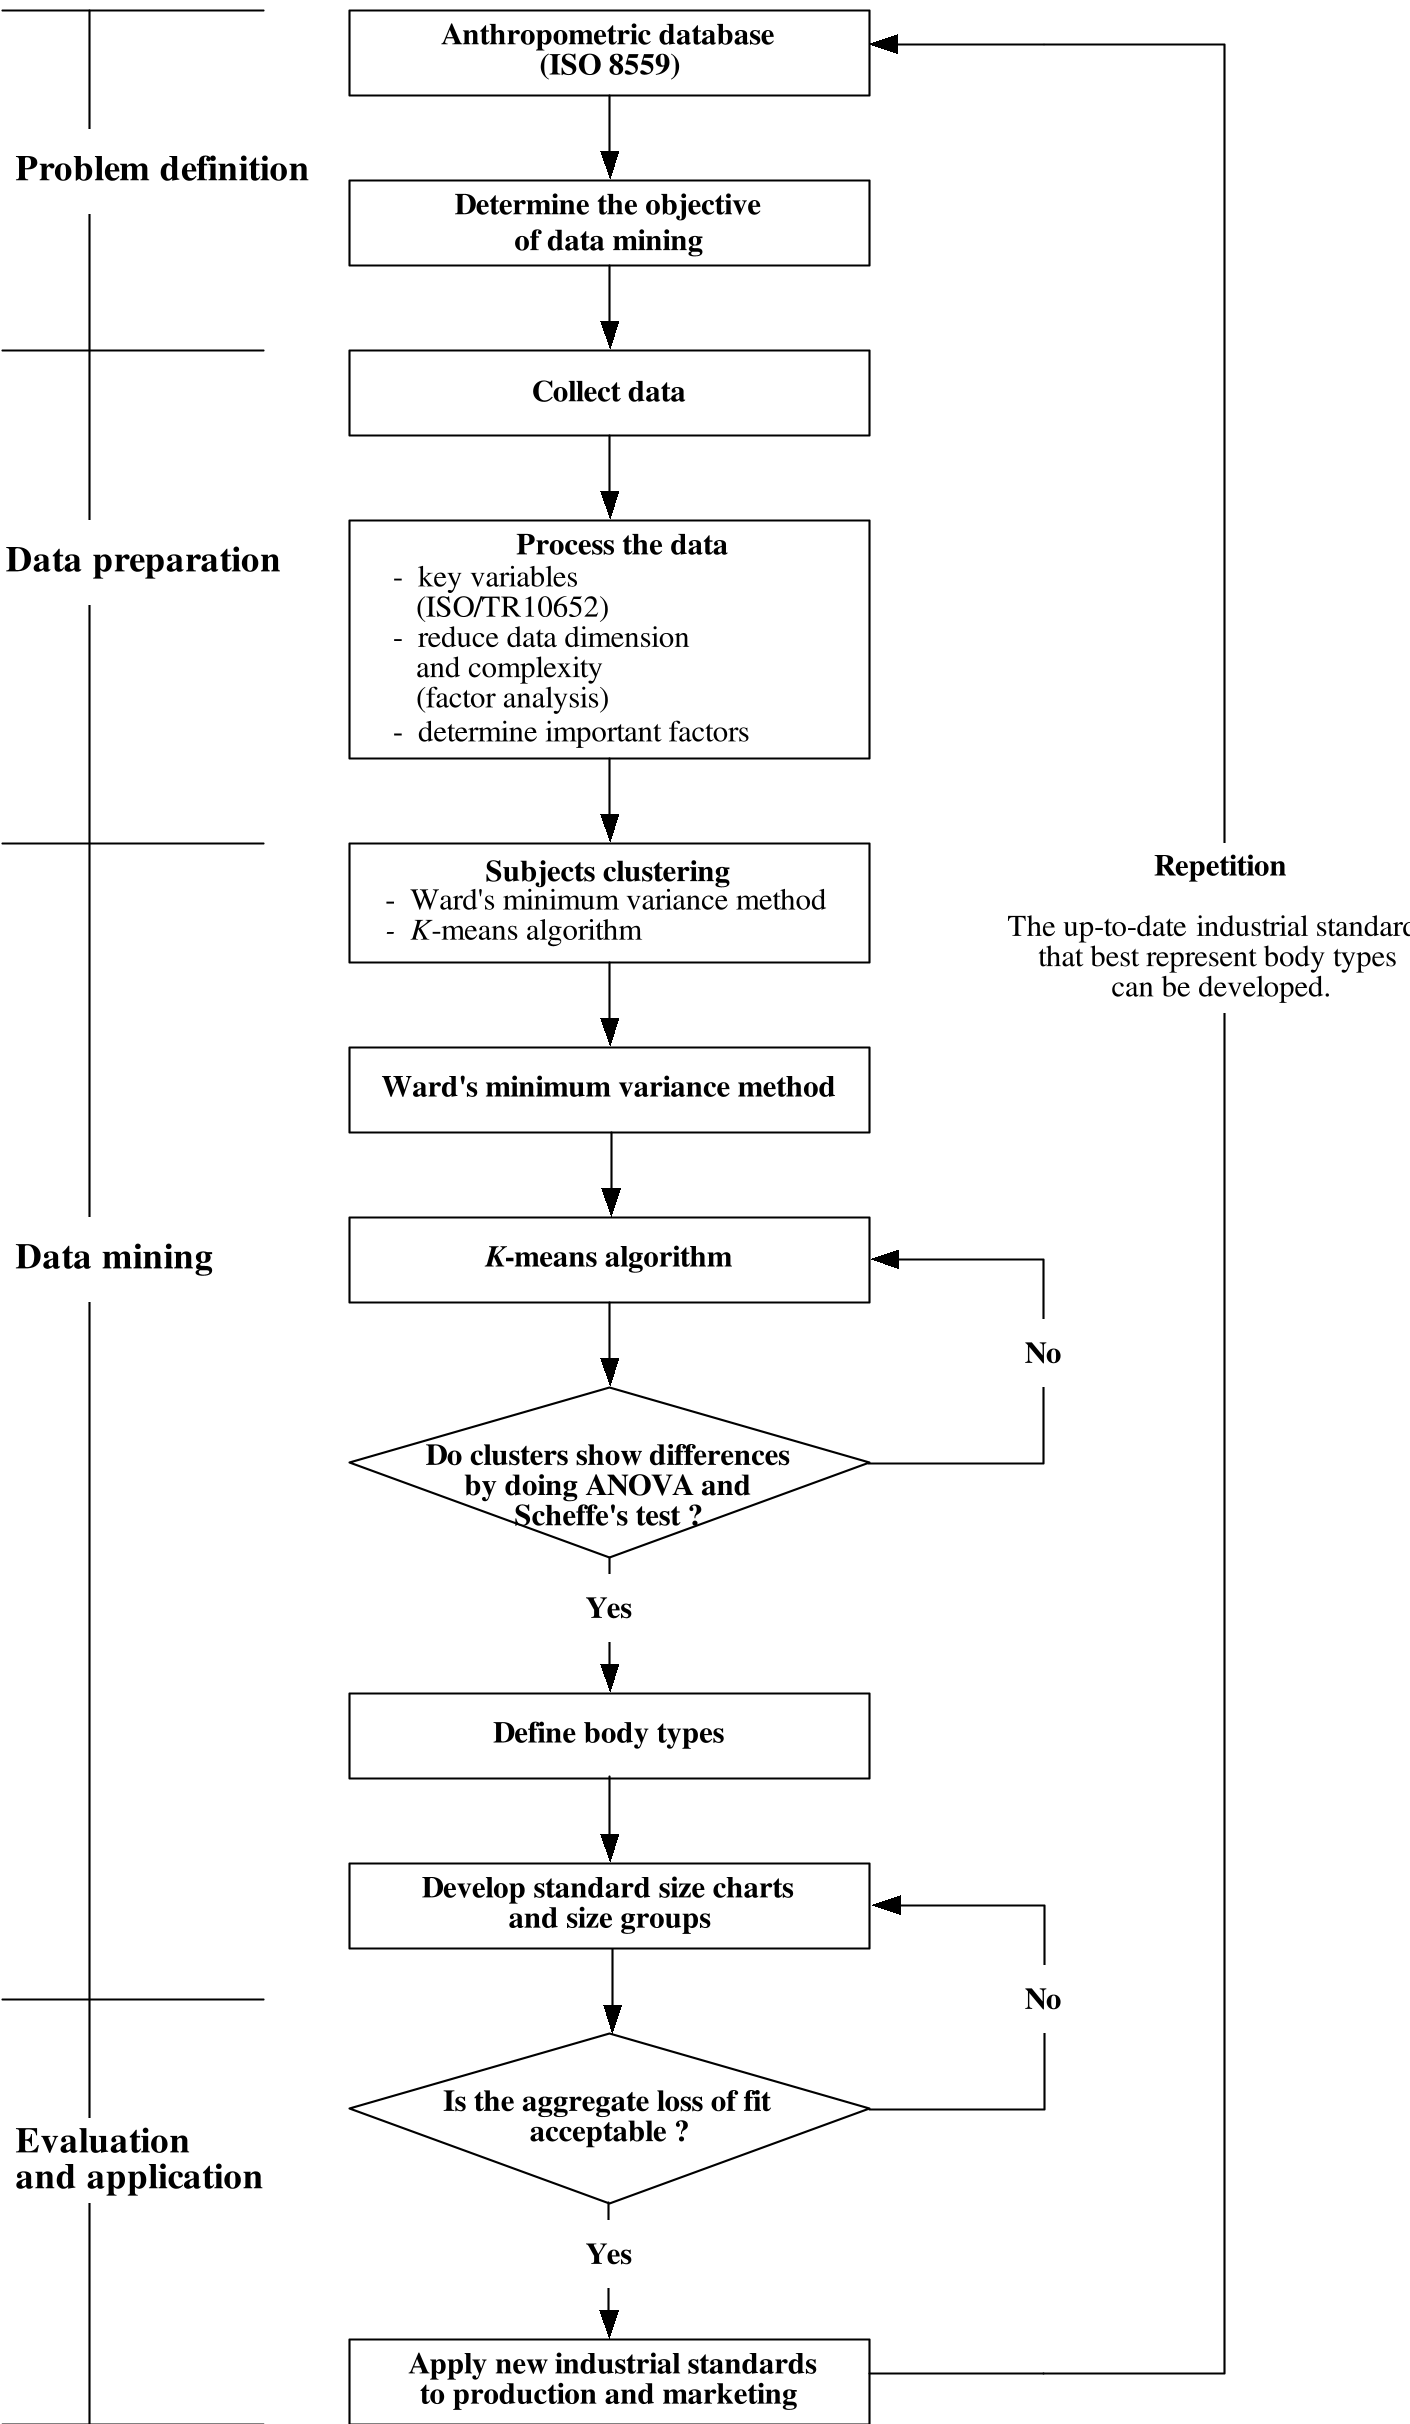
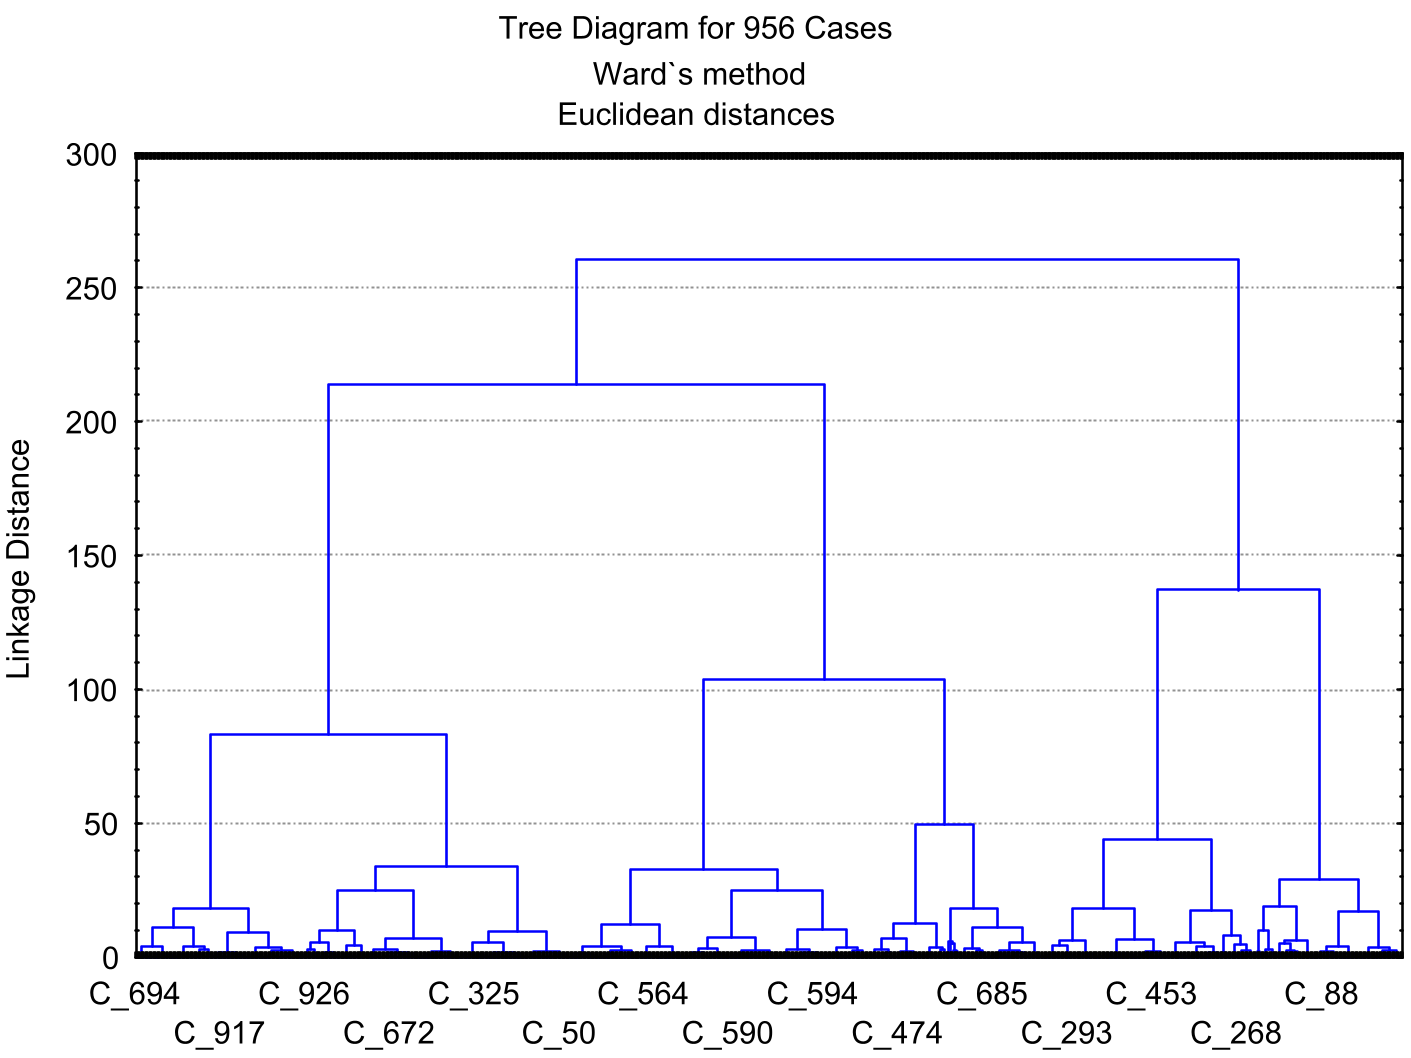
- Stage 1: Ward’s method is used to create a dendrogram (tree diagram), allowing researchers to see the natural hierarchy and decide on the optimal number of clusters (which was determined to be 5).
- Stage 2: K-means then refines these clusters to ensure that within-group variance is minimized, resulting in stable "Body Types."
Experiments & Results: Mapping the Human Form
The study categorized subjects into five body types (Y, A, B, C, D), where Type Y represents smaller girths and Type D represents larger girths.
SOTA Benchmarking: Aggregate Loss of Fit
To validate the effectiveness, the study uses the Euclidean distance metric to calculate the "Aggregate Loss." This measures how far an average individual is from the assigned standard size center.
- Ideal Threshold: < 3.6 cm.
- Achieved Result: All five body types stayed well below this threshold (ranging from 2.5 to 3.3).
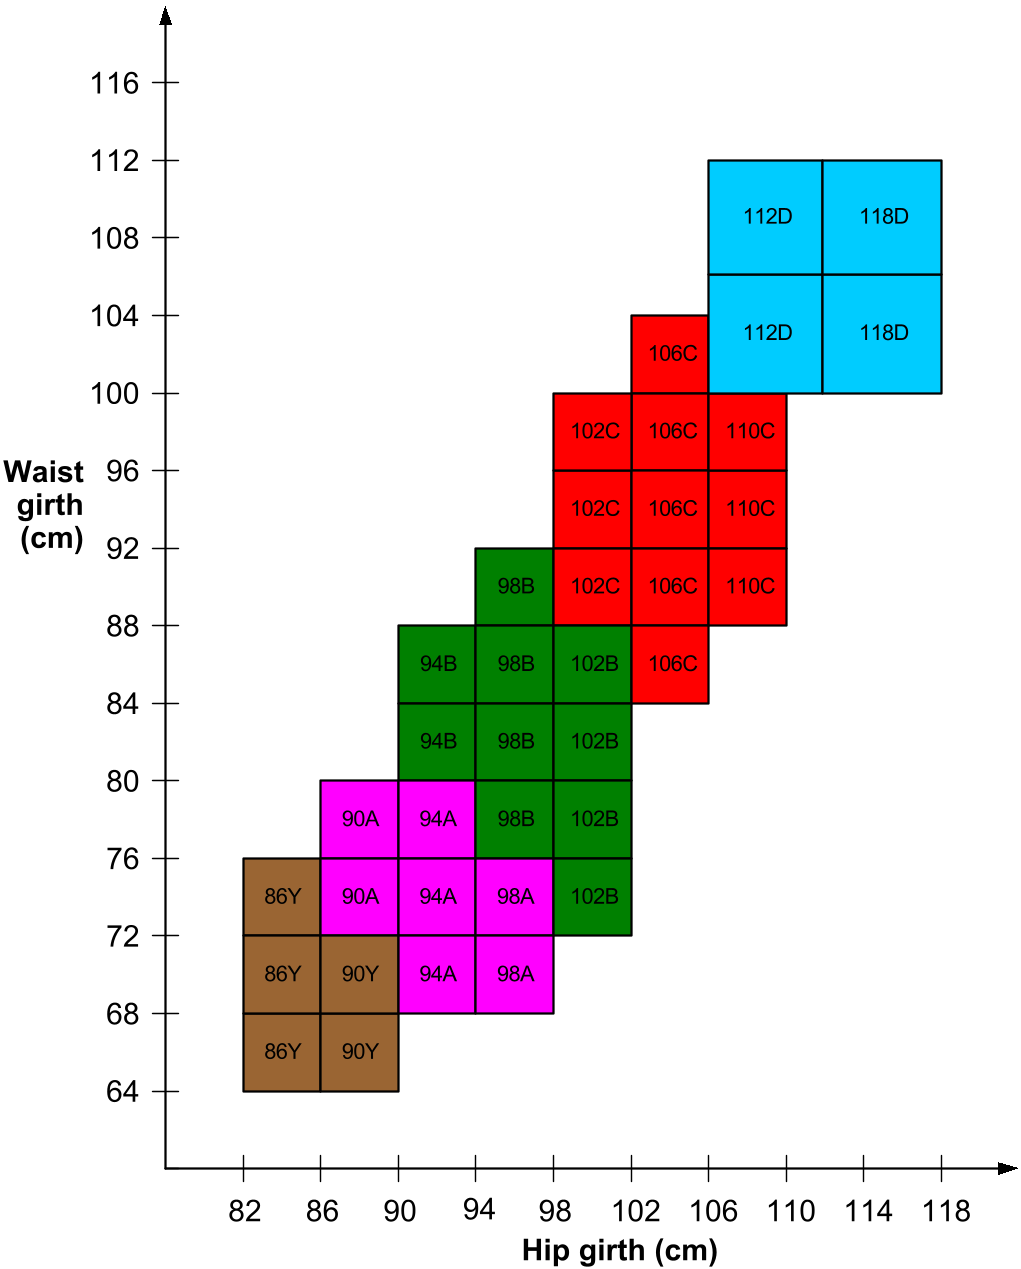
By prioritizing the most common body types and eliminating extreme outliers (about 2.8% of the sample) that would disproportionately increase production costs, the system achieves a 95.08% coverage rate with only 93 size groups—drastically more efficient than many international standards.
Critical Analysis & Conclusion
The Industry Impact
This paper moves the apparel industry toward Mass Customization. By understanding the distribution of body types (e.g., recognizing that 31% of the population belongs to "Type B"), manufacturers can plan production volumes for specific hip/waist ratios rather than firing in the dark.
Limitations & Future Work
While the framework is robust, it relies on physical measurements. With the rise of Computer Vision, integrating this data mining framework with 3D body scanning and computer-aided design (CAD) would be the logical next step. Furthermore, the "Aggregate Loss" model assumes a linear relationship between dimensions, which may not capture all aesthetic nuances of garment fit.
Summary
Hsu's empirical study proves that Data Mining isn't just for software—it's a fundamental tool for physical manufacturing. By applying clustering to anthropometry, we can create industrial standards that are as dynamic and diverse as the people they serve.