
DBN for Predicting Corporate Defaults: Moving Beyond Manual Feature Engineering
Deep belief networks for predicting corporate defaults
This paper introduces a novel approach for corporate default prediction by utilizing Deep Belief Networks (DBN) to process stock return time series. By converting 1D return data into 2D graph representations, the method achieves superior classification performance compared to traditional SVM-based baselines across multiple time horizons.
TL;DR
Predicting corporate default has historically been a game of manual feature selection. This paper upends that tradition by treating stock return sequences as images and feeding them into Deep Belief Networks (DBN). By leveraging unsupervised representation learning, the DBN "sees" patterns of distress that traditional Support Vector Machines (SVM) miss, boosting prediction accuracy from ~54% to over 70%.
Background Positioning
In the aftermath of the 2008 financial crisis, the importance of accurate default prediction peaked. While classical models like Altman's Z-Score and the KMV-Merton model laid the foundation, they often fell short due to rigid parametric assumptions. This work represents a bridge between signal processing and financial econometrics, positioning itself as an early adopter of the "deep learning for finance" movement.
Problem & Motivation: The Fatigue of Manual Features
Why do traditional models struggle?
- Selection Bias: Practitioners must decide which moving averages or ratios matter (e.g., 5-day vs. 30-day).
- Explicit vs. Implicit: Traditional ML algorithms like SVM require "hand-holding" via explicit feature extraction. If the relevant factor isn't in your spreadsheet, the model can't learn it.
- The Insight: The authors realized that stock returns are more than just numbers—they are signals. By converting these signals into a 2D space (visual graphs), they unlock the ability for Deep Learning to perform automated feature engineering.
Methodology: The Power of Stacked RBMs
The core of the approach lies in the transformation and the architecture.
1. The Graph Representation
Instead of a raw list of floats, the 1D stock return is mapped to a 2D matrix .
- X-axis: Days prior to default.
- Y-axis: Normalized stock returns (-1 to 2).
- This allows the model to treat financial volatility like a visual texture or shape.
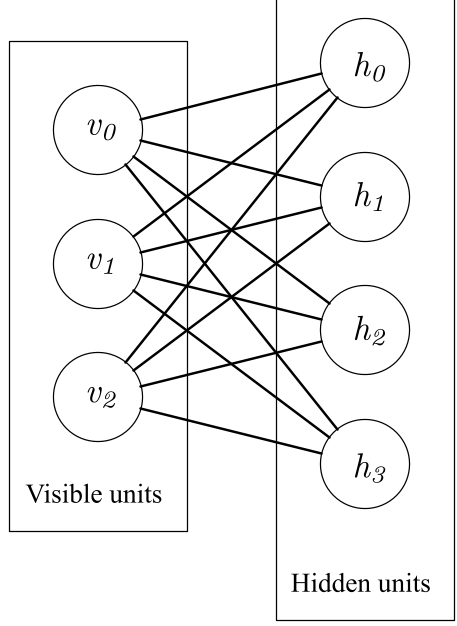 Fig 1: Converting the 30-day prior to default return vector into a 150x200 graph.
2. Deep Belief Network (DBN) Architecture
The DBN is built by stacking Restricted Boltzmann Machines (RBM).
- Pre-training: Each RBM layer is trained greedily using Contrastive Divergence to reconstruct its input, capturing hierarchical features (lower layers capture local return spikes, higher layers capture long-term trends).
- Fine-tuning: Once the weights are initialized via pre-training, a logistic regression layer is added, and the entire stack is optimized using backpropagation to classify "Default" () vs "Solvent" ().
Experiments & Results
The authors tested the model on a massive dataset of American companies from 2001 to 2011. They compared the DBN against an SVM baseline that used standard financial averages.
Performance Comparison
The results were conclusive across all time windows (30, 180, and 360 days):
- SVM Average Accuracy: ~54% (barely better than a coin flip).
- DBN Average Accuracy: 68% - 72%.
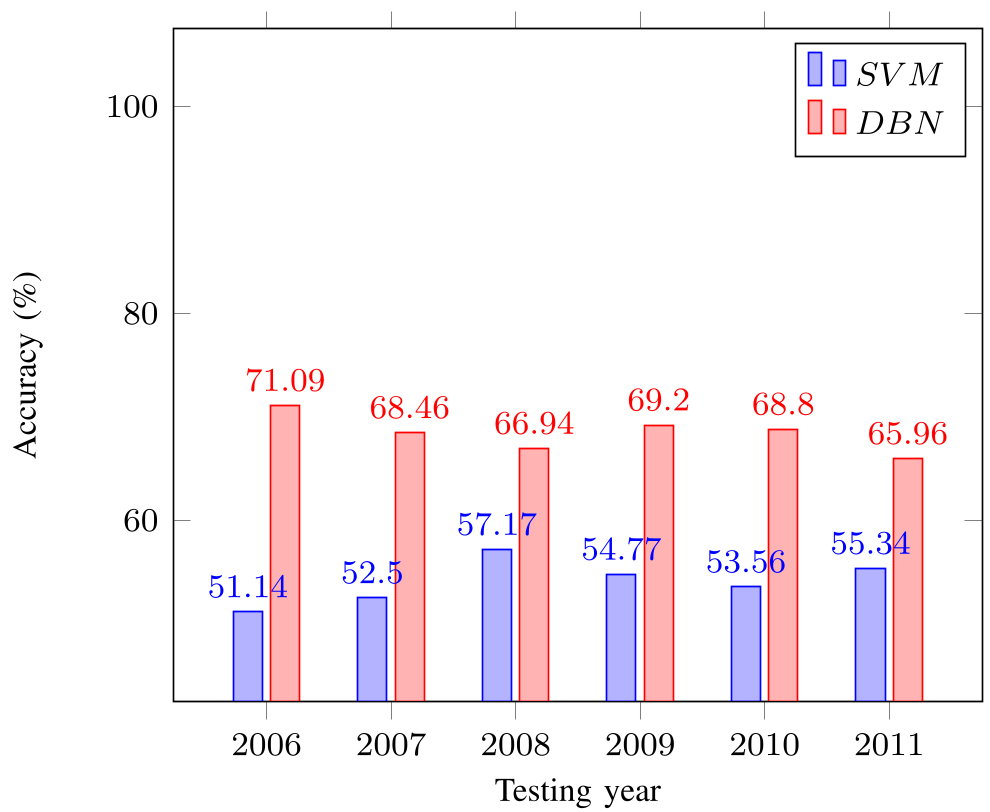 Fig 2: Accuracy comparison for 180-day prior returns. Red (DBN) consistently outperforms Blue (SVM).
Internal Representations
The most significant finding is that DBN performance improves as the time horizon expands to 180 days (72%), suggesting the model is particularly adept at capturing mid-range cyclical signs of financial distress that are too complex for simple averages.
Critical Analysis & Conclusion
Takeaway
The DBN’s success proves that representation learning is as vital in finance as it is in computer vision. By implicitly learning features, the model bypasses the "feature engineering bottleneck."
Limitations
- Complexity vs. Latency: Training DBNs with RBM pre-training is computationally more intensive than SVM.
- Interpretability: While the DBN is more accurate, it is a "black box" compared to the Z-Score, which may pose challenges for regulatory compliance in finance.
Future Outlook
The next logical step in this research branch is likely replacing the static DBN with Convolutional Neural Networks (CNNs) or Recurrent Neural Networks (RNN/LSTMs) to better handle the temporal sequence directly without the intermediary step of generating images, or perhaps using Attention mechanisms to identify which specific days in the 360-day window are the "smoking guns" for bankruptcy.