
Deep Learning on Landscapes: Scalable Population Estimation via Satellite Imagery
A Deep Learning Approach for Population Estimation from Satellite Imagery
This paper introduces a deep learning framework for high-resolution population estimation (0.01° x 0.01°) using multi-spectral Landsat 7 satellite imagery. By repurposing a VGG-style Convolutional Neural Network (CNN) for classification of population density bins, the authors demonstrate that structured population data can be inferred directly from unstructured pixel-level remote sensing data across the continental United States.
TL;DR
Researchers from Georgia Tech have developed a Convolutional Neural Network (CNN) approach that "sees" how many people live in an area just by looking at Landsat satellite images. By training on US Census data, the model can predict population density at a 1km² resolution, matching official government estimates in accuracy while providing much higher spatial detail.
Background Positioning
In the landscape of computational sustainability, this work sits at the intersection of Remote Sensing and Demography. It moves beyond traditional "Areal Interpolation" (where population is simply spread evenly across a map) toward a "Semantic Disaggregation" approach, where the model learns the visual vocabulary of human settlements.
Problem & Motivation: The Data Gap
Knowing "where" and "how many" people live in a region is critical for disaster response and urban planning. However, we face a paradox:
- Censuses are accurate but slow (every 10 years).
- Projections are timely but spatially "blunt" (usually only at county or state levels).
- Satellite Data is abundant and high-resolution but inherently unstructured.
The authors' insight was that deep learning could bridge this gap by learning the mapping between the visual texture of the Earth's surface (buildings, roads, fields) and the hidden demographic numbers associated with those pixels.
Methodology: The Core
The architecture is based on VGG-A, a proven convolutional backbone. The researchers processed the continental US into a grid of 0.01° × 0.01° cells.
1. From Regressions to Bins
Instead of predicting a raw number (which is highly noisy), the authors discretized population into 17 classes using a log-scale. This transforms a difficult regression problem into a more stable classification task, allowing the model to distinguish between "unpopulated," "rural," "suburban," and "dense urban."
2. Feature Extraction & Boosting
While the CNN performs the pixel-level heavy lifting, the authors introduced an ingenious secondary step called CONVAUG. They took the probability outputs (the softmax layer) of the CNN and used them as input "features" for a Gradient Boosting model. This hybrid approach allowed the model to maintain the spatial intelligence of the CNN while leveraging the statistical power of boosting for administrative-level totals.
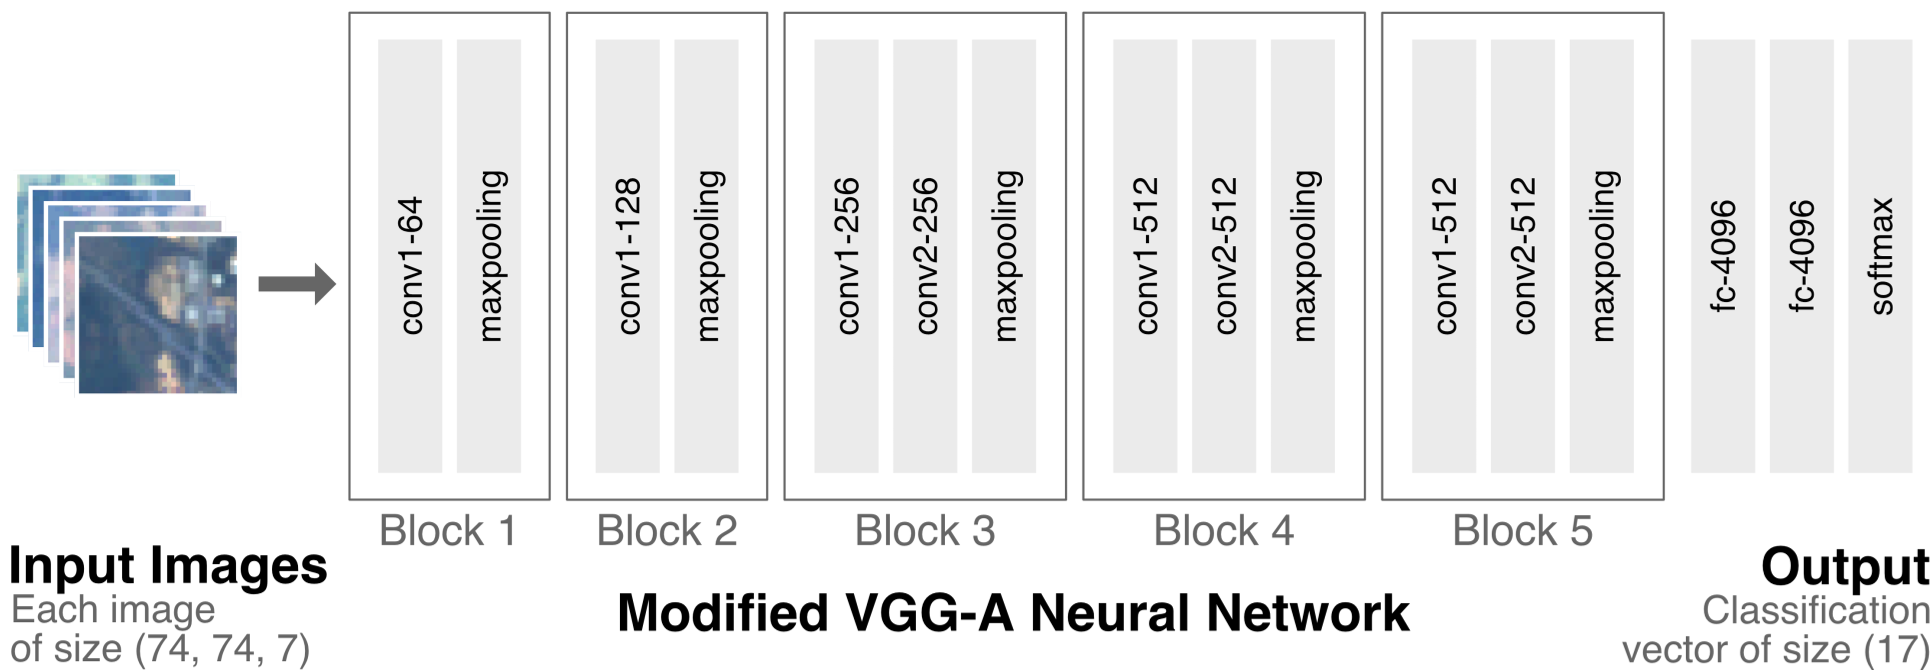 Figure 1: The modified VGG-A architecture taking 7-band Landsat imagery to output one of 17 population classes.
Experiments & Results: Does the Network "See" Humans?
The results were validated against the 2010 US Census. While traditional census models (which use births, deaths, and migration data) remain the gold standard, the CNN's CONVAUG method achieved an R² of 0.9365, proving it captured the essential signal of human distribution.
Qualitative Intuition
The most fascinating part of the study is the "Activation Maps." As the class number increases (representing higher population), the model's focus shifts:
- Lower Classes: The model triggers on highways and small rural roads.
- Higher Classes: The model picks up on dense gridded suburban layouts and large multi-story urban structures.
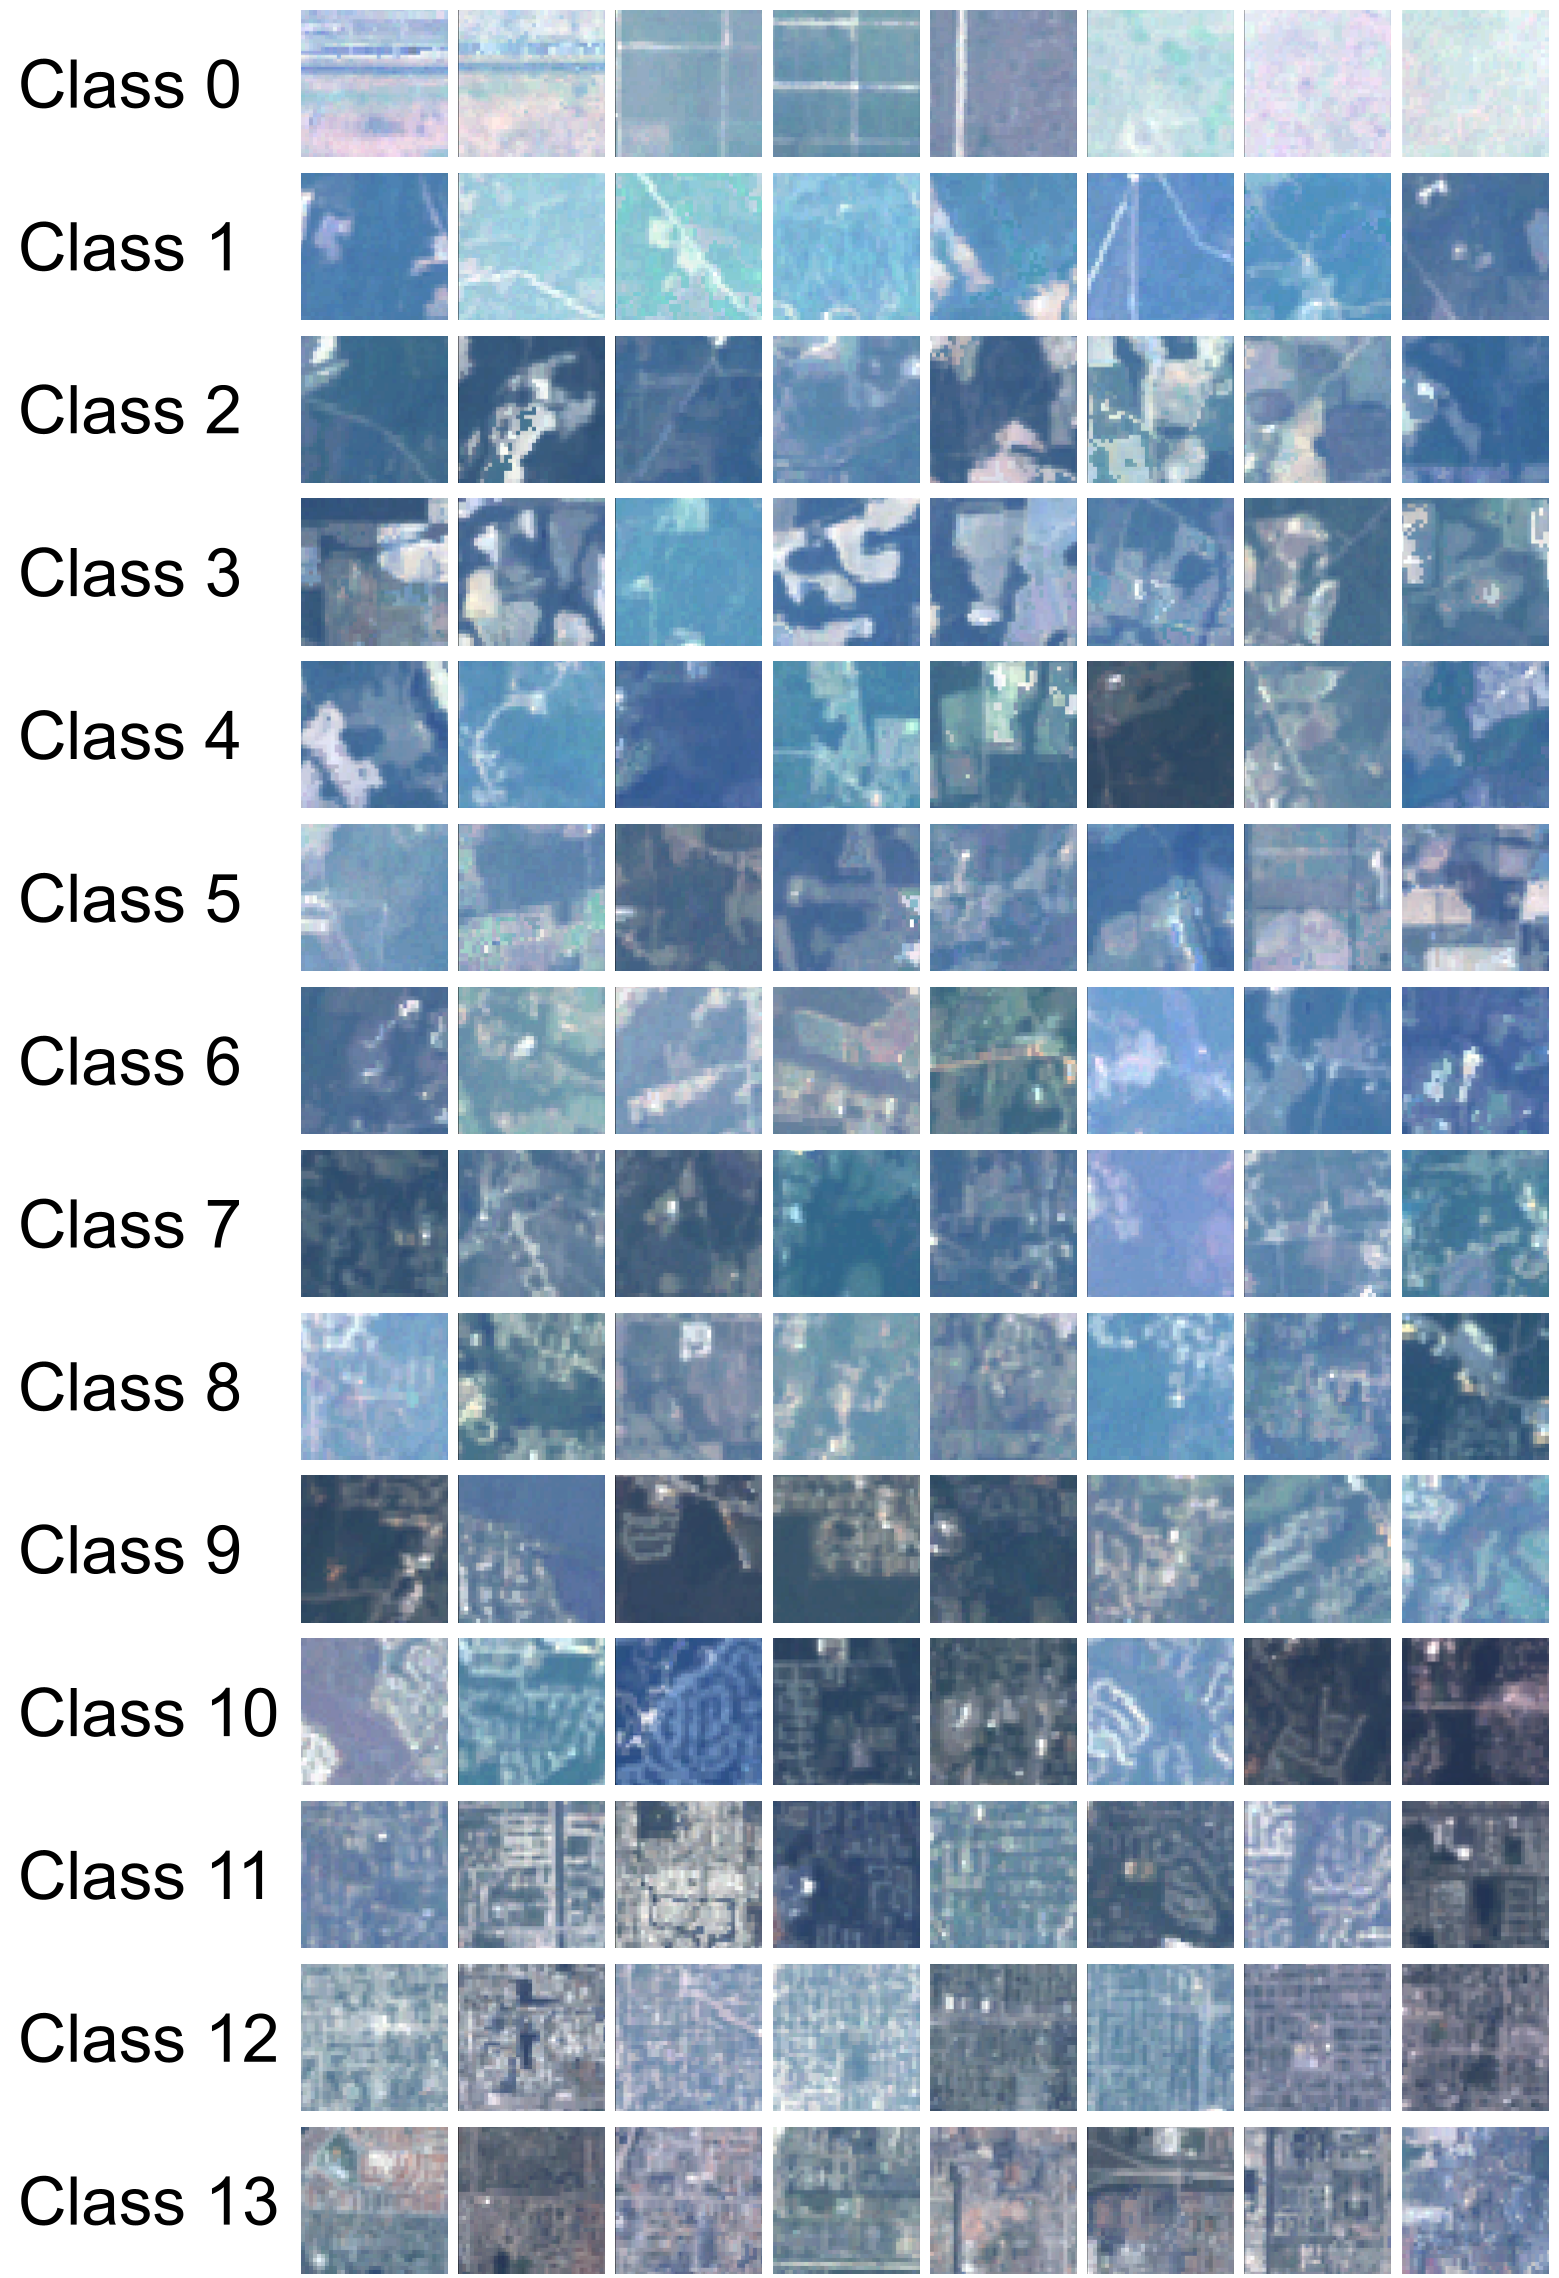 Figure 2: Examples of satellite images that most confidently trigger different population classes, showing the transition from rural roads to dense urban grids.
Critical Analysis & Conclusion
The "Disney World" Error
The paper honestly addresses a key limitation: the model occasionally over-predicts population in areas with heavy infrastructure but no residents, such as Walt Disney World or Military Depots. Since the model only sees pixels, it assumes large buildings mean many people lived there.
Takeaway
Despite these edge cases, the work is a significant step toward autonomous demography. For developing nations that cannot afford a multi-billion dollar census, this technology offers a "good enough" baseline that can be updated as frequently as a satellite flies overhead.
Future Outlook: The inclusion of night-time lights as a "prior" and the use of temporal data (observing how an area changes over 5 years) could likely eliminate the "Disney World" false positives and refine the precision of global population maps.