
Defect Prediction 2.0: Why Who Talks to Whom Matters More Than Code Changes
16017_Defect prediction using social network analysis on issue repositories.
This paper introduces a novel defect prediction approach using Social Network Analysis (SNA) metrics derived from developer communication in issue repositories. By mining comments on task items in IBM Rational Team Concert (RTC) and Drupal projects, the authors demonstrate that human interaction patterns are superior predictors of software quality compared to traditional churn metrics.
TL;DR
While most defect prediction models obsess over code complexity (Lines of Code, Churn), this research argues that people are the root cause of bugs. By analyzing the "social network" of developers—specifically how they communicate within issue trackers—the authors built a model that drastically reduces false alarms and saves over 60% of verification effort in professional environments like IBM's Rational Team Concert.
The "Performance Ceiling" of Code Metrics
For decades, researchers have tried to predict bugs using static code metrics (McCabe complexity) or process metrics (Code Churn). However, these methods have hit a ceiling. Even the best models often produce high False Alarm Rates (Pf). In a commercial setting, a high false alarm rate is a budget killer: it forces engineers to waste time inspecting perfectly healthy code.
The researchers' insight? Software is a social construct. If the communication network surrounding a specific file is fragmented, inefficient, or overly centralized, that file is statistically more likely to contain defects.
Methodology: Mapping the Human Factor
The study focused on two major projects:
- IBM Rational Team Concert (RTC): A large-scale, distributed commercial project.
- Drupal: A massive open-source CMS.
From Comments to Graphs
The authors didn't just look at code; they looked at the Issue Repository. They treated every developer who commented on a specific task as a "node" in a social graph. If two developers commented on the same issue, an "edge" (connection) was drawn between them.
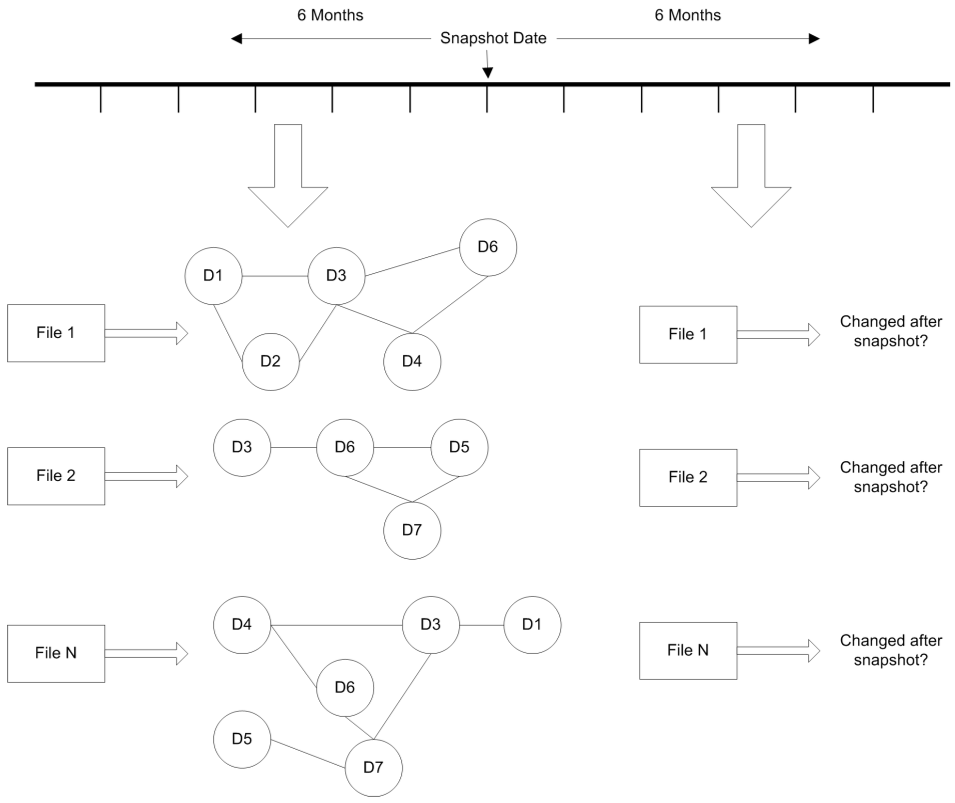
The SNA Metric Suite
The researchers used 10 Social Network Analysis (SNA) metrics to describe the "health" of these communication clusters:
- Betweenness Centrality: Does one developer act as a bottleneck for information?
- Bridge Rate: Are there fragile connections that, if broken, would isolate parts of the team?
- Clustering Coefficient: How "cliquish" is the group working on a file?
- Characteristic Path Length: How many "hops" does information take to travel across the team?
Experimental Results: Breaking the Ceiling
The results were compared against Code Churn, which was previously considered the gold standard for defect prediction.

In the RTC project, the SNA model was a game-changer. While Churn metrics had a slightly higher detection rate (Pd), they also had a massive 38% False Alarm rate. The SNA model slashed that to 9%, achieving a much higher "Balance" (0.84 vs 0.73).
Cost-Benefit Analysis
Using Cost Curves, the authors demonstrated that by using SNA metrics, managers could find 80% of defects by inspecting only 39% of the files, whereas random selection or weaker models would require inspecting twice as much code.
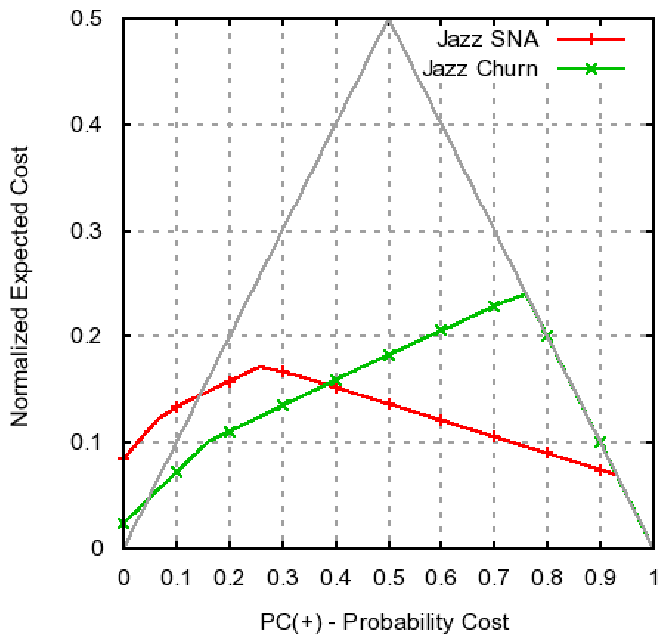
Critical Insight: The "Why"
Why does this work?
- Coordination Complexity: When many disconnected people talk about an issue, the risk of misunderstanding the requirements increases.
- Information Silos: High "Bridge" rates or low "Density" indicate that information isn't flowing freely, leading to integration bugs.
- Human Patterns: Social metrics capture the "past patterns" of a team better than a simple count of how many lines changed.
Conclusion and Limitations
The study proves that issue repositories are a gold mine of social data. However, the authors admit a key limitation: they only tracked comments. Developers also speak via email, Slack, or face-to-face. Even so, the signal from the issue tracker alone was strong enough to outperform traditional code analysis.
For project managers, the message is clear: If you want to know where the next bug will appear, don't just look at the code—look at the conversation.