
The Demographic Clock: Why Your Country’s Age Structure Predicts Banking Crises
Descriptive Modeling of Systemic Banking Crises
This paper presents a descriptive modeling approach to identify socio-economic risk factors associated with systemic banking crises. Using a machine learning methodology called Subgroup Discovery (SD) on IMF and World Bank data (1976-2007), the researchers identified that demographic trends—specifically the percentage of active population (ages 15-64) and male life expectancy—are primary indicators of financial fragility.
TL;DR
While economists usually blame banking crises on "black swan" financial events, this research reveals a deeper, structural culprit: Demographics. By applying Subgroup Discovery machine learning to decades of global data, the authors found that a shrinking active population and stagnating life expectancy create the "dry brush" that allows financial sparks to turn into systemic infernos.
Background Positioning
This work sits at the intersection of Macroeconomics and Interpretable Machine Learning. Rather than creating a high-frequency predictive "ticker," the authors provide a descriptive framework that identifies the environment of a crisis. It shifts the focus from "When will the bank fail?" to "What structural vulnerabilities make this country prone to failure?"
Problem & Motivation: The Failure of Purely Financial Models
Most early warning signals (EWS) focus on liquid assets, interbank exposures, and debt-to-GDP ratios. However, history shows that financial systems do not exist in a vacuum. The authors argue that the real economy (socio-economic health) dictates the resilience of the financial sector. The pain point addressed here is the lack of "human-in-the-loop" models—standard econometric tools like probit analysis often fail to provide actionable, intuitive rules that policymakers can use to address long-term structural decay.
Methodology: Mining for "Interesting" Subgroups
The core of this study is the Subgroup Discovery (SD) methodology. Unlike standard classification (which tries to label every case correctly), SD looks for "Goldilocks zones"—subsets of data that are statistically unique and large enough to be meaningful.
The ILLM Algorithm
The authors used the Inductive Learning by Logic Minimization (ILLM) system. It constructs rules by:
- Feature Construction: Creating binary conditions from numerical data (e.g., "Is Money Growth > 15%?").
- Rule Optimization: Using a quality measure to balance coverage (True Positives) against noise (False Positives).
- Human Intervension: Selecting rules that offer the best "Descriptive Power"—meaning they make sense to an economist.
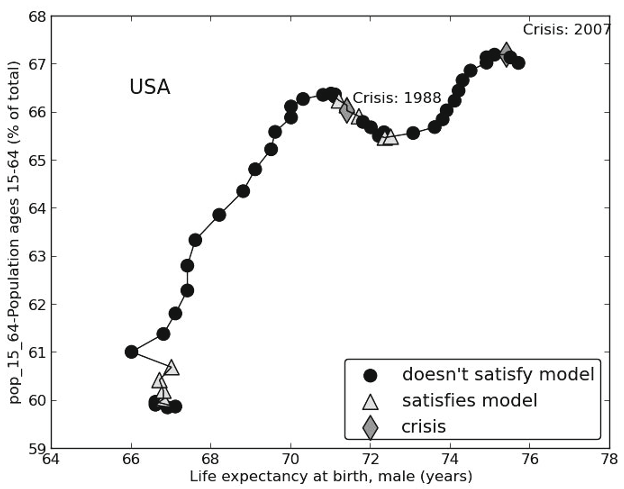 Figure: Prognostic curves for active population (15-64) showing the inevitable downward trend that satisfies the "Crises Risk" condition.
The Two Faces of Risk: Key Models Found
The study distilled 105 indicators down to two primary risk models. Both prominently feature the active population (ages 15-64).
Model 1: The Monetary-Demographic Trap
Rule: (M2 Money Growth > 15.42%) AND (Active Population < 61.21%)
This model highlights that aggressive monetary expansion is significantly more dangerous in countries with an aging or small workforce. For example, Yemen (1996) and India (1983) fits this profile perfectly.
Model 2: The Quality of Life Stagnation
Rule: (Slope of Active Population < 0.11) AND (Slope of Male Life Expectancy < 0.20)
This is the most striking finding. Even if a country is wealthy, if the trend of its workforce is shrinking and its life expectancy is flatlining, it enters a high-risk state.
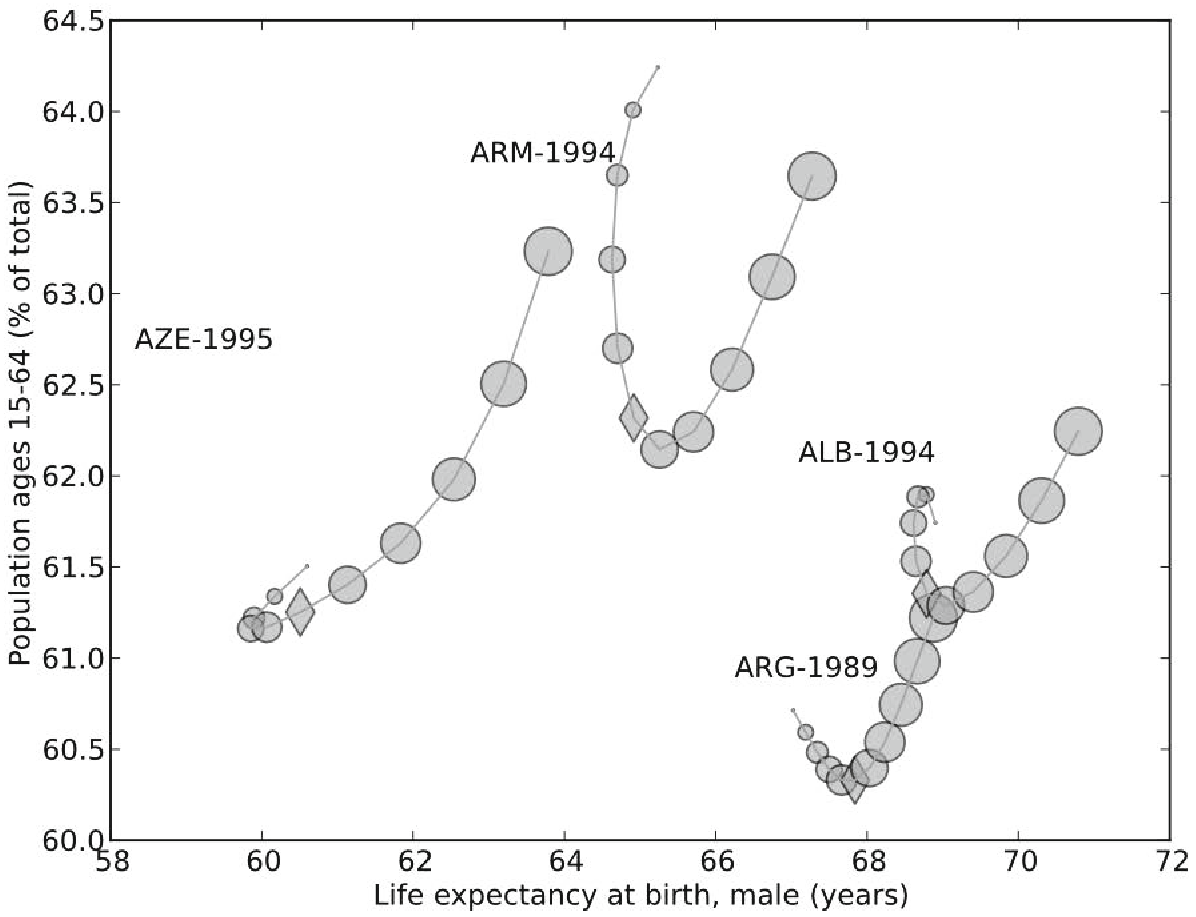 Figure 2: True positive cases (Armenia, Azerbaijan, Albania, Argentina) showing decreasing active population trends before the diamond (crisis year).
Experiments & Results: Detecting the "Un-detectable"
The second model is particularly impressive because it successfully "predicted" (descriptively) the USA 2007 crisis and the Finland 1991 crisis.
- USA 2007 Case: While financial indicators were messy, the demographic trends showed a stagnation in active population and male life expectancy starting in 2006.
- Finland 1991 Case: Followed a sharp decrease in active population growth between 1985 and 1991.
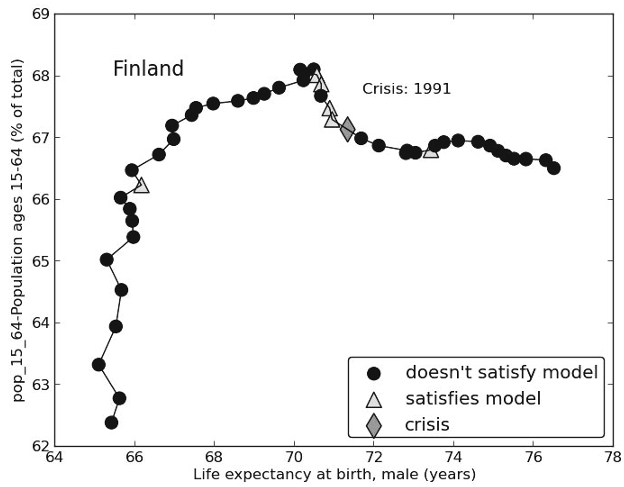 Figure 5: Historical changes in active population and life expectancy for the USA and Finland over 48 years, highlighting crisis zones.
Performance Metrics
- Specificity: The models achieved ~89% specificity for the second model, meaning they have a very low false-alarm rate for "healthy" countries.
- Statistical Significance: Permutation testing showed , proving these demographic links are not mere coincidences.
Critical Analysis & Conclusion
The "Closed Loop" Insight
The most profound takeaway is the "Closed Loop" theory: Current financial health influences future social/demographic characteristics (via health funding and environment), which in turn determines financial stability decades later.
Limitations
- Precision: The models are descriptive, not high-frequency predictive. They tell you the "forest is dry," but not exactly when the "match" will be struck.
- Migration: The UN demographic projections used (Figure 6) don't fully account for economic migration, which could mitigate the risk for some developed nations.
Future Outlook
As the "Global Aging" phenomenon accelerates, particularly in Europe and East Asia, the "Active Population Slope" condition will be satisfied almost everywhere. This research suggests that investing in quality of life (life expectancy) may be one of the most effective long-term strategies for maintaining financial stability.