
Beyond Popularity: Detecting Influential Actors via Network Attractiveness
On the Detection of Influential Actors in Social Media
The paper introduces a novel influence measure called "Attractiveness Value T," which identifies influential actors based on their ability to attract new members to a social network over time. Using time-sliced graph decomposition and the Independent Cascade (IC) model, the authors demonstrate that their method outperforms traditional metrics like Indegree or Betweenness in influence maximization tasks on Twitter and developer mailing lists.
TL;DR
Is a user with a million followers truly influential, or just famous? This paper shifts the focus from static popularity to dynamic recruitment. By introducing the Attractiveness Value T, the authors suggest that the most influential actors are those who consistently bring new participants into the network. This temporal, growth-oriented metric proves more effective for maximizing information spread than traditional metrics like Indegree or Betweenness.
Background: The Growth of Communities
In the landscape of social media analytics, identifying "influentials" is often the holy grail for marketing and political strategy. However, most researchers rely on stationary "snapshots" of graphs. This paper posits that influence is not a state but a process of attraction. By analyzing how a network grows over time, we can identify the specific nodes responsible for "pulling" outsiders into the community.
Methodology: Capturing Temporal Attractiveness
The core innovation lies in the S-subgraph and the T-Measure. Instead of looking at the total edges an actor has, the authors decompose the network into time slices (EP-slices).
1. The S-Subgraph Logic
The authors define a specific type of connection: an edge that connects an existing member () to a person who just joined the network in the current time slice (). This filters out old relationships and focuses purely on new acquisition.
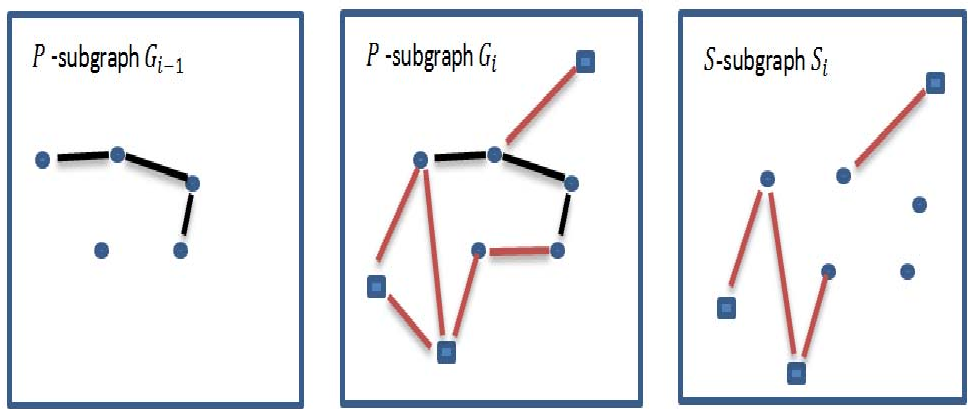 Fig 1: Decomposing the P-graph into S-subgraphs to isolate new member attraction.
2. The Attractiveness Formula
The Attractiveness Value for an actor is the sum of their normalized degrees within these S-subgraphs:
This calculation rewards actors who are "magnets" for new users across multiple stages of the network's evolution.
Experimental Results & Validation
The authors tested their hypothesis on two distinct datasets: the Asterisk Developer Community (small, collaborative) and a Twitter Photo Challenge (large, viral).
Influence Maximization
To prove that identifies better "seeds" for viral content, they ran an Independent Cascade (IC) Model simulation. This model simulates how information jumps from node to node based on probability.
 Fig 2: Comparison of information spread efficiency. The T-measure (top line) consistently activates more nodes than traditional Centrality measures.
Key Findings:
- The Popularity Fallacy: In the Twitter dataset, the correlation between and the number of followers was nearly zero (). This confirms that having a large audience does not mean you are effective at attracting new people to a specific topic.
- Diffusion Power: When selecting "seed nodes" to start a campaign, using the measure resulted in a significantly higher number of total activated users compared to using Betweenness or Closeness centrality.
Critical Insight & Conclusion
The "Attractiveness Value T" reveals a hidden layer of social dynamics: the bridge between the community and the outside world. While high-indegree nodes (celebrities) are popular, the "Attractors" (high T-value) are the ones who actually expand the community's boundaries.
Limitations & Future Work
The study currently uses equidistant time slices (e.g., every 24 hours), which might not capture the varied "burstiness" of social media events. The authors plan to develop more adaptive time-slicing strategies to better model rapid information spikes. For practitioners, the takeaway is clear: if you want to grow a movement, don't just look for the most followed users—look for the ones who are actively recruiting the uninitiated.