
Decoding Artificial Societies: Categorizing Social Networks via Diffusion Characters
Using diffusion characters for the taxonomy of self-organizing social networks
The paper introduces a method for categorizing self-organized social networks using "Diffusion Characters" and a pseudo-metric. Applied to Iterated Prisoners Dilemma with Choice and Refusal (IPDCR), it successfully builds a taxonomy that classifies artificial societies based on their emergent contact patterns.
TL;DR
How do we measure the "distance" between two social networks? This paper presents a novel approach using Diffusion Characters to analyze self-organized networks emerging from the Iterated Prisoner's Dilemma with Choice and Refusal (IPDCR). By treating network connectivity as a probability distribution of random walks, the authors provide a mathematical framework to classify artificial societies, revealing that social structure is a direct reflection of the evolutionary strategies within a population.
The Evolution of Contact: Why Structure Emerges
In standard game theory, agents are often forced to interact with everyone. However, in the real world—and in this study's IPDCR model—agents have agency: they can choose who to play with and refuse offers from known defectors.
This mechanism leads to the emergence of Social Networks. Some populations form tight-knit cooperative cores, while others fragment into "stars" or isolated "wallflowers." The challenge was not just seeing these patterns, but quantitatively categorizing them without prior labels.
Methodology: The Geometry of Diffusion
The core innovation lies in the use of Diffusion Characters (DC).
1. The DC Matrix
The authors take the adjacency matrix of a network and calculate its Leontief inverse: .
- is a diffusion parameter (set to 0.5).
- Physical Intuition: Each entry in the resulting matrix represents the probability that a random walk starting at node will end at node . It maps the "reachability" and "influence" of every node across the entire topology.
2. Column Entropy (CE) Distance
To compare two networks of the same size, the authors:
- Calculate the entropy of each column in the DC matrix (representing how "spread out" a node's influence is).
- Sort these entropy values to create a signature vector for the network.
- Use the Euclidean distance between these vectors to define a pseudo-metric—a measure of how similar two network architectures are.
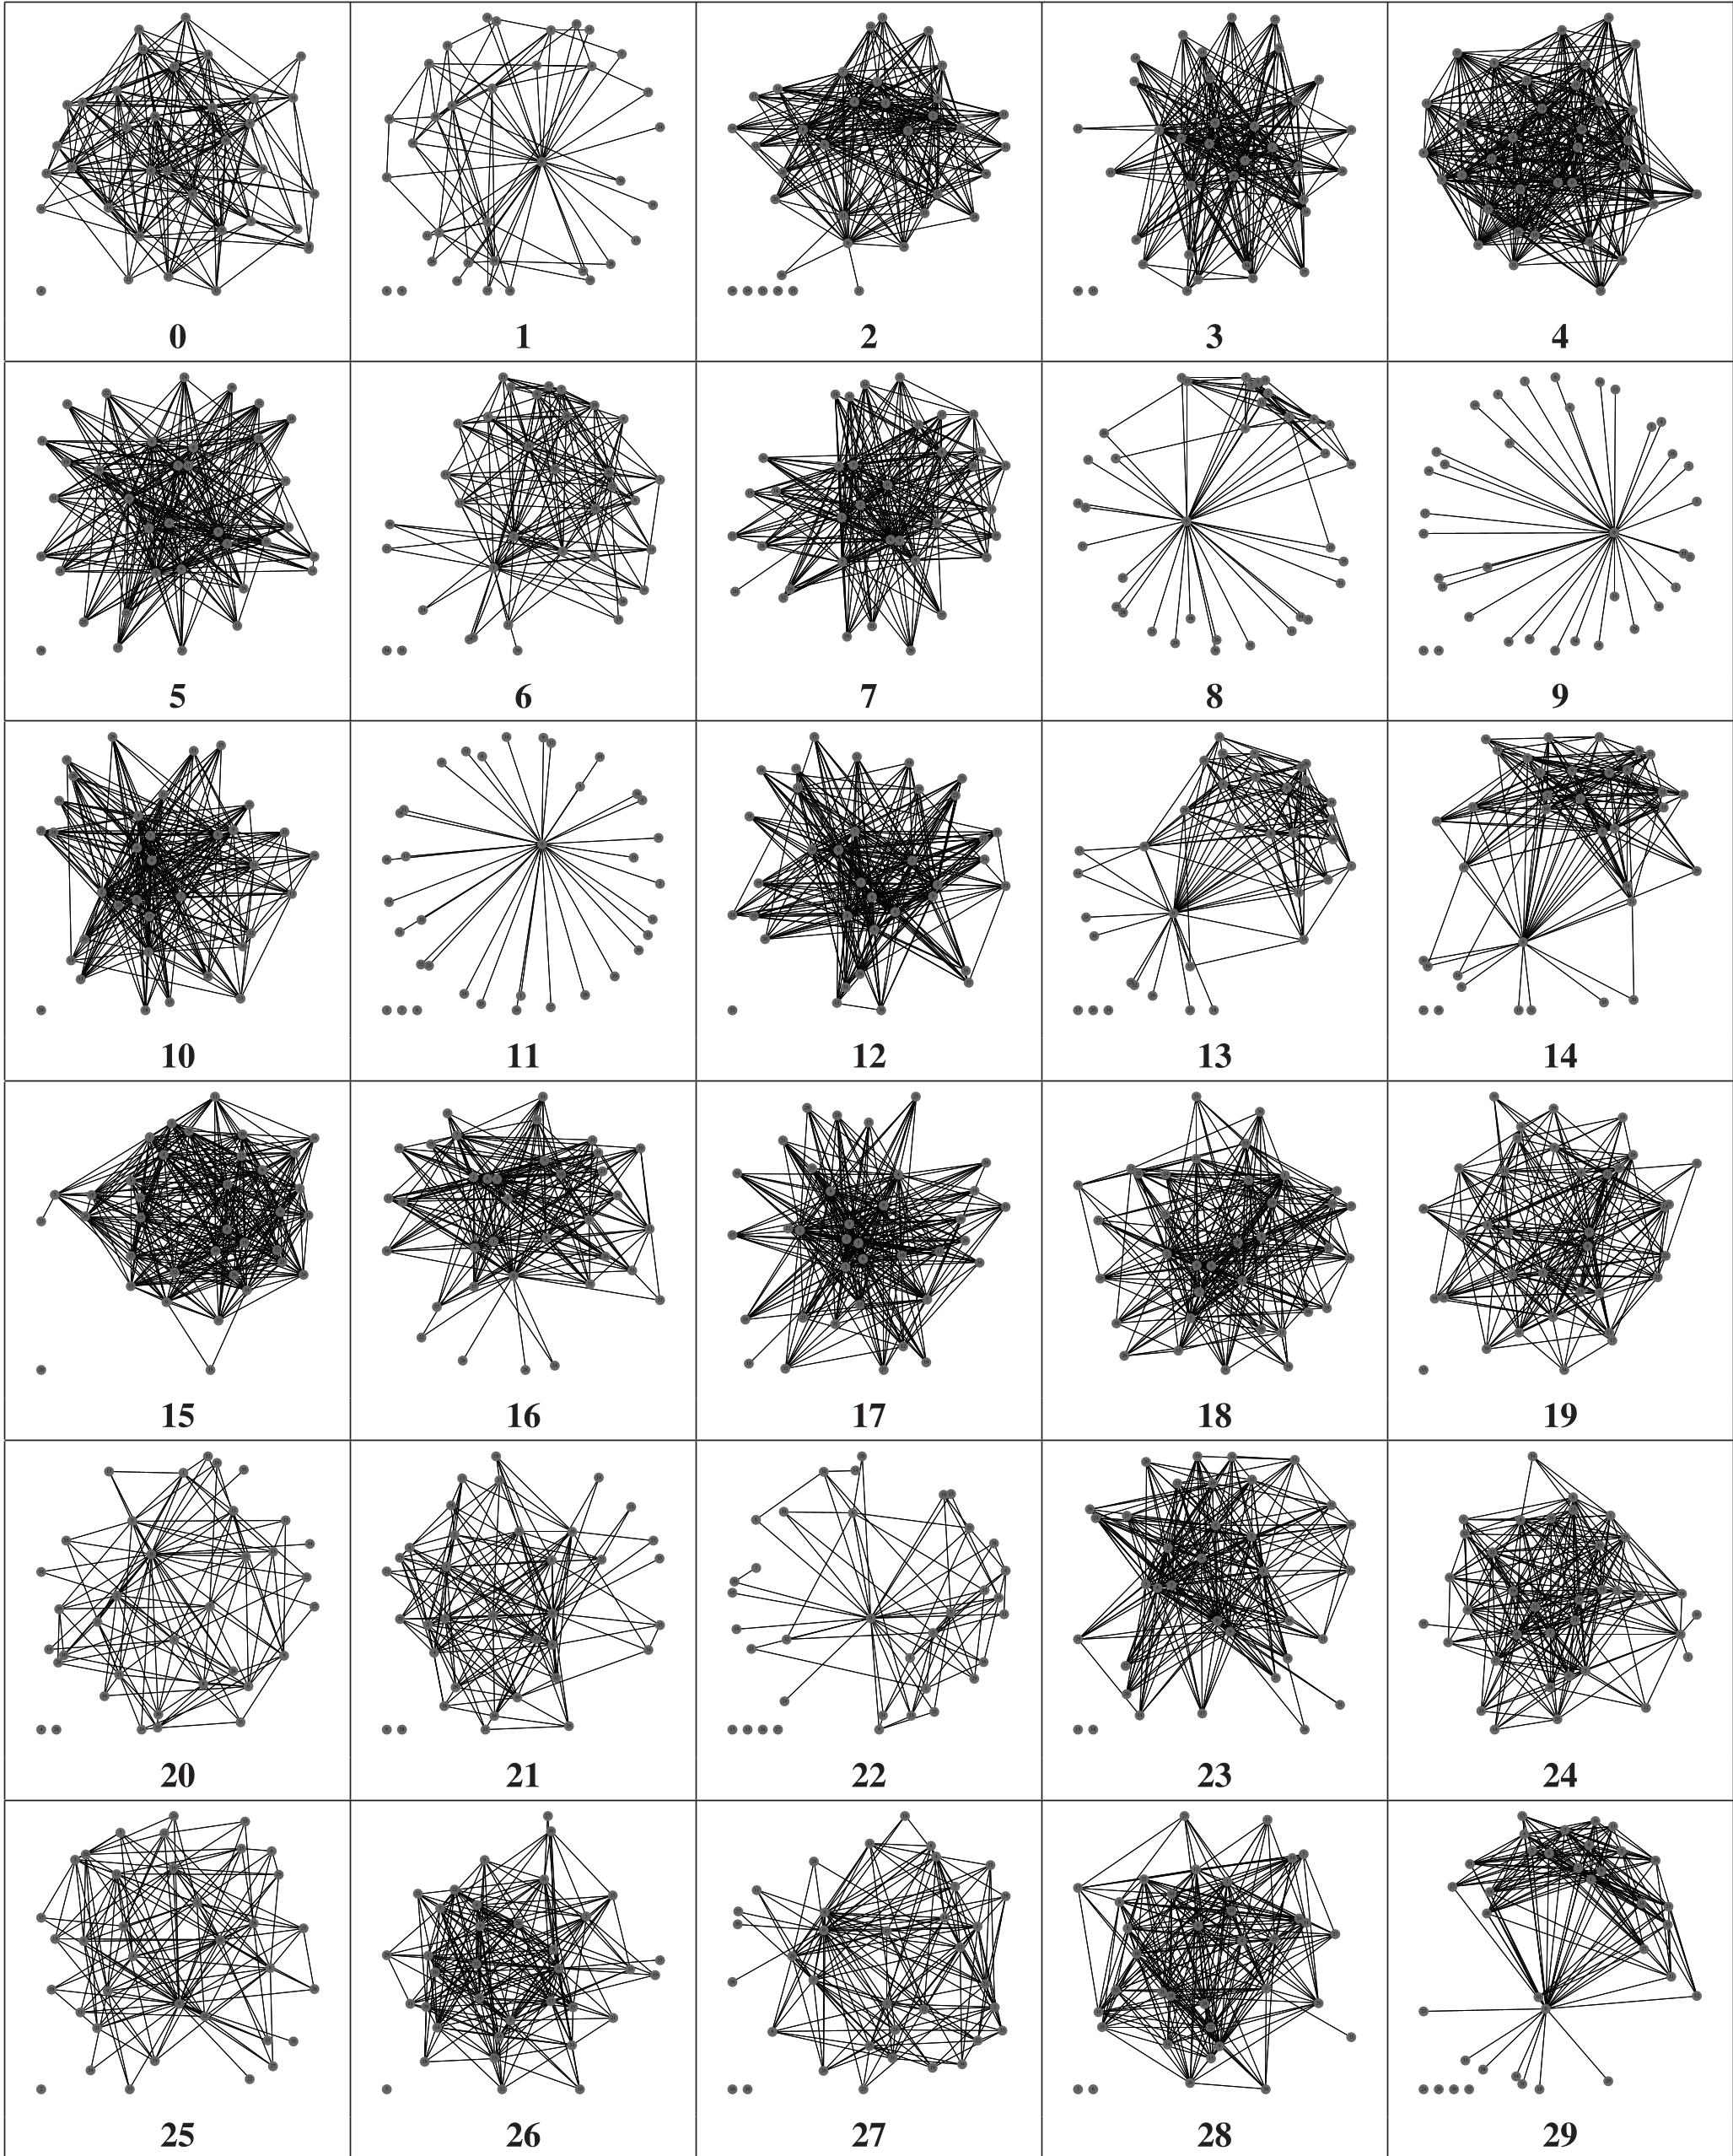 Fig 1: Spring-physics renderings showing the visual diversity of the 30 evolved social networks.
Taxonomy and Clades: What the Data Reveals
Using UPGMA (Unweighted Pair Group Method with Arithmetic Mean), the authors generated a taxonomic tree (phylogeny) of the 30 networks.
Key Structural Discoveries:
- The Stars: Networks 9 and 11 were identified as nearly identical. Visually, they consist of a single central hub.
- The Cores: Networks 7 and 17 showed a "highly connected core" of players. Interestingly, these populations also exhibited nearly identical fitness trajectories over 1000 generations, proving that topology is a proxy for evolutionary success.
 Fig 2: The Diffusion Character entropy-based taxonomy. Note how it clusters visually similar networks together.
Critical Insight & Future Outlook
The beauty of this method is its unsupervised nature. It doesn't need to know "what" a star network is; the math of diffusion naturally groups them together.
Limitations:
- The current approach requires networks to be of the same size to compare entropy vectors easily.
- It is computationally expensive to recalculate DC matrices for every generation in a large-scale simulation.
The Path Ahead:
This technique has massive potential for Epidemiology. By classifying contact networks, researchers can better predict how a disease might spread through different "types" of societies without needing a full simulation of every single individual. Furthermore, integrating "emotional" agents into these networks could lead to even more complex, human-like social taxonomies.
Takeaway for the AI Community
As we move toward multi-agent systems and decentralized AI, understanding how connectivity self-organizes is crucial. Diffusion Characters provide a mathematically rigorous way to "fingerprint" these systems, offering a bridge between micro-level agent behavior and macro-level social structure.