
Beyond "LOL": Decoding Social Hot Topics through Frequency Ratios and Geographic Hubs
Discovering hot topics using Twitter streaming data social topic detection and geographic clustering
The paper introduces a method for social topic detection and geographic clustering using Twitter streaming data. By utilizing a "ratio of word frequency," the authors effectively filter out daily small talk to identify hot topics and use temporal correlations to group US states into geographic communities.
TL;DR
This research addresses the noise problem in Social Network Analysis (SNA). While Twitter is a goldmine for real-time info, the most frequent words are usually emotional fillers. By introducing a "Ratio of Word Frequency" and applying graph-theoretical clustering, the authors can distinguish a major snowstorm or a Supreme Court ruling from daily "small talk" and map how these topics ripple across geographic boundaries.
Background & Motivation: The Noise in the Signal
In the era of information explosion, Twitter serves as a global nervous system. However, mining this system is notoriously difficult. If you simply rank words by frequency, "love," "like," and "haha" will always win. Prior efforts to solve this used complex probabilistic models (like PLSI or LATM), but these are often slow and require significant manual intervention. The authors sought a lightweight, automated way to extract meaningful spikes in conversation and see if those spikes correlate with physical geography.
Methodology: The "Ratio" Insight
The core innovation is the Ratio of Word Frequency (). Instead of looking at absolute counts, the researchers look at the velocity of change:
- Why it works: If a word is used 1 million times every day (like "lol"), the difference () is near zero, making the ratio small. If a word like "Easter" jumps from 1,000 to 50,000 uses, the ratio nears 1.0.
- Geographic Clustering: Once topics are identified, the authors calculate the correlation of these topic "heartbeats" across all 50 US states. States that "pulse" together on a topic are grouped using the Louvain Algorithm, a standard in network science for finding communities.
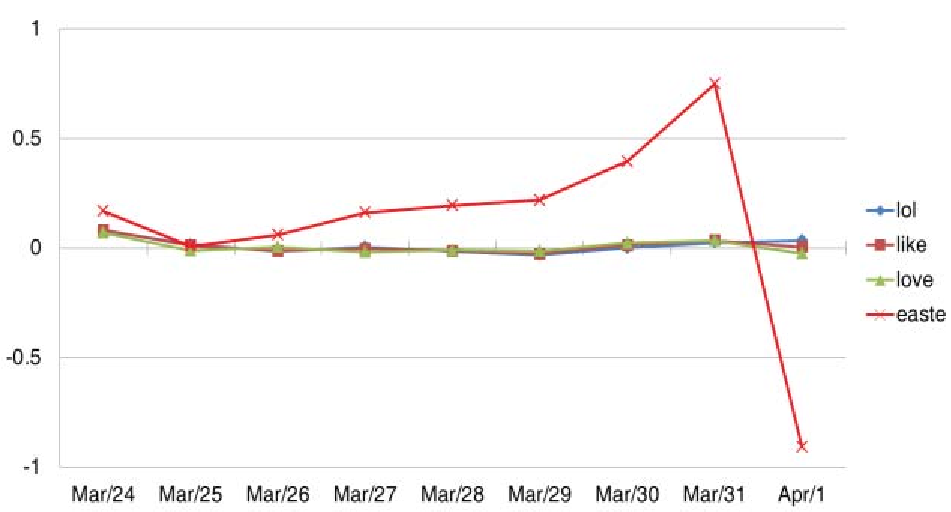 Fig 1: Notice how "Easter" spikes dramatically in the ratio metric compared to the flat lines of emotional words.
Experiments: Validating the Pulse of a Nation
Using 18.7 million geo-tagged tweets from March to April 2013, the study identified several key events:
- Weather: A storm moving from Missouri to Pennsylvania.
- Social Issues: The Supreme Court same-sex marriage hearings (March 26).
- Sports: A World Cup qualifier and NBA games.
Geographic Ground Truth
The "Weather" topic provided the most striking result. The clustering algorithm didn't just group states randomly; it clustered them by the actual path of the storm.
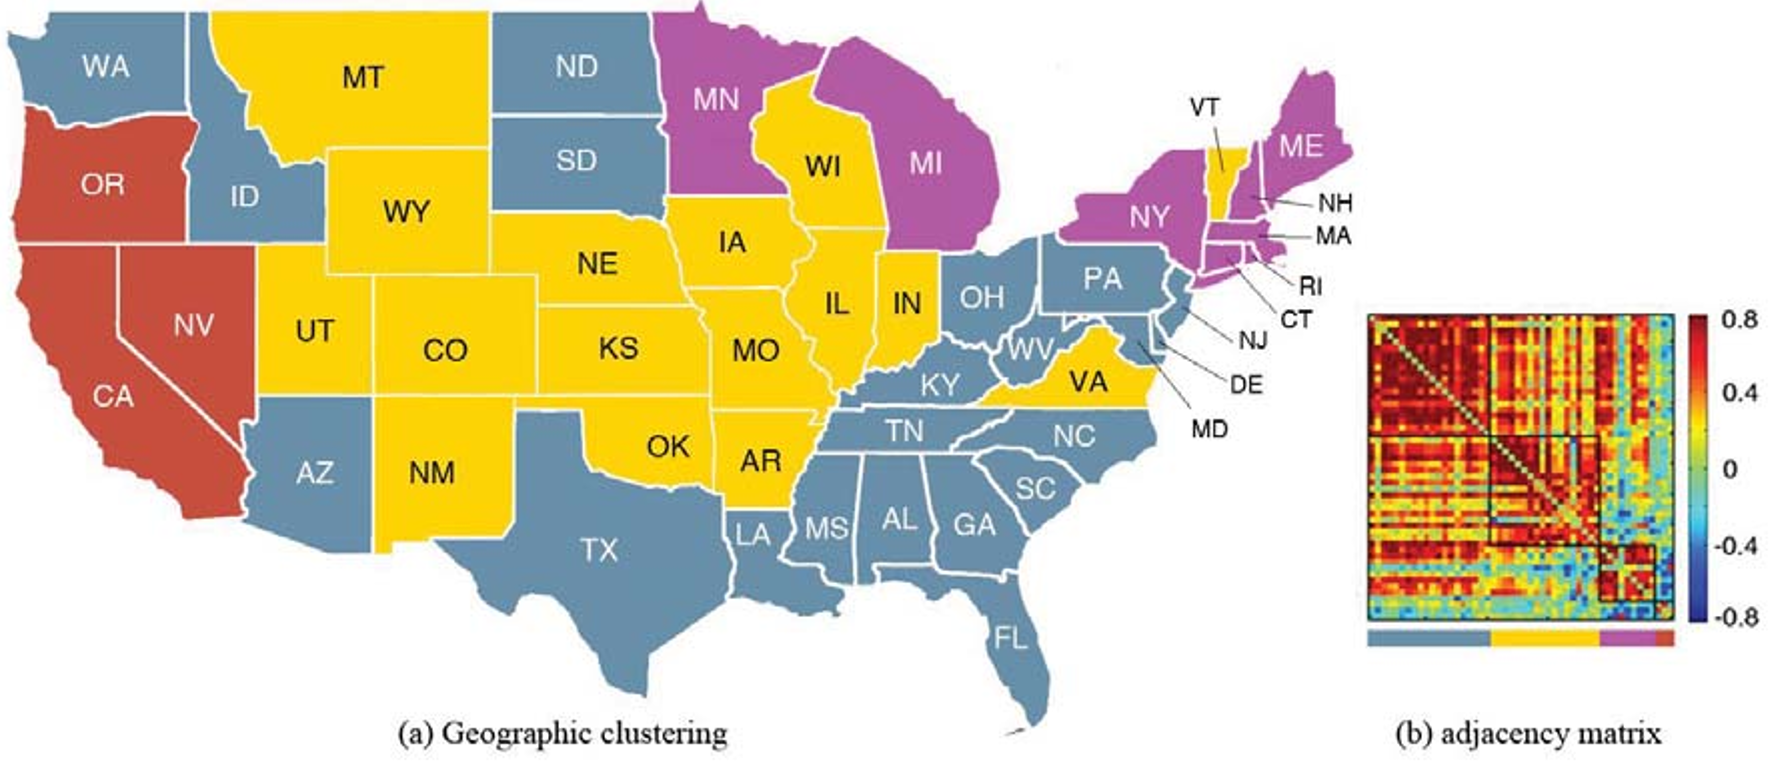 Fig 2: Community I (Blue) perfectly tracks the states hit by the heavy March 24-25 snowstorm.
Critical Analysis & Conclusion
The beauty of this work lies in its simplicity. By moving from magnitude to momentum, the authors bypassed the need for expensive training or complex NLP models prevalent in 2013.
Takeaways:
- Inductive Bias: The study assumes that social topics are characterized by synchronized bursts across specific regions.
- Limitations: The "ratio" approach might miss "slow-burn" topics that grow gradually over months. It also relies heavily on geo-tagging, which is a feature used by a small subset of Twitter users.
- Future Work: Today, this could be combined with LLM-based sentiment analysis to not just detect what is being talked about, but how the regional sentiment differs across the detected clusters.
This paper remains a foundational example of how simple mathematical transformations can solve "Big Data" noise problems effectively.